What You'll Learn
Given the anticipated yet ultimately unrealized shocks to public markets in 2023, advisors may have benefited from an approach that allowed for participation in the public equity markets while simultaneously targeting downside protection.
Supply and demand imbalances supported alternative investment opportunities, especially for direct lending and private equity secondaries strategies.
Learnings from the previous zero-interest-rate period may no longer apply in the years ahead, particularly in relation to the potential role of hedge funds.
Diversifying and adopting a long-term view will likely remain effective strategically for advisors amid continued uncertainty across markets.
As we turn to 2024, we share a few lessons learned and new questions worth exploring from a year characterized by both surprising resilience and persistent uncertainty.
Alternatives broadly continued to gain interest from advisors, particularly on the back of a challenging 2022 for those allocated primarily to stocks and bonds. Such growth was likely made possible in part by increasingly diverse product and technological innovation—both of which enabled broad strides in access for financial advisors.
Of course, though the effects may have been less immediately visible, alternatives were just as impacted by the evolving macroeconomic environment as the public market in 2023. With a diverse set of asset classes and strategies, this year’s story of alternatives has been marked by notable considerations that advisors might take into 2024. Here, we offer five that we believe merit extra attention.
1. Public Market Exposure Doesn’t Have To Be Binary.
If you only read the headlines from 2023—near certainty of a recession, a banking crisis, a seemingly inevitable commercial real estate collapse, wars in the Middle East and Ukraine—you may have been quite certain of disaster for the markets. But if you had sat out of public equity markets completely, you would have missed out on a 23% return in the S&P 500 (Exhibit 1). It seemed to have paid to maintain public market exposure.

Footnotes
Source: Bloomberg, S&P 500 Index represented by the SPX Index, as of 12/13/2023.
The US public equity market maintained strong performance throughout 2023, despite headline-making disruptions (Exhibit 1)
Hindsight is still only 20/20, and the year’s performance doesn’t mean there wasn’t or still isn’t danger lurking. How could advisors have positioned portfolios to both protect and participate given the uncertainty, both to the upside and downside?
One potential option that was increasingly utilized in 2023 was structured notes (Exhibit 2). Transaction volume for protection notes, which are designed to seek market exposure to an underlying asset class or market while seeking to provide full or partial downside protection, more than doubled YoY in the first three quarters of 2023. If employed early in the year, these notes, depending on how they were structured and their underliers, may have provided advisors with a degree of portfolio protection against anticipated risks, while maintaining the potential for upside participation in case those risks didn’t manifest in a market downturn.

Footnotes
Source: SPi US Structured Products Market Overview November 2023. This communication is being provided for informational purposes only and should not be considered as a solicitation or offer to buy and sell any securities or related financial instruments. Such an offer or solicitation may only be made to certain qualified investors through formal offering documents of such security or investment product. Financial advisors are strongly encouraged to consider all applicable risks before making an investment decision.
Structured notes utilization continues to grow broadly, with transaction volume for protection notes more than doubling compared to the first three quarters of last year (Exhibit 2)
The lesson is to consider all the tools at your disposal, particularly for the year ahead as many of the same uncertainties still loom large.
2. Supply and Demand Imbalances Can Signal Opportunity.
There are few principles that continue to stand the test of time and reflect behavior like the law of supply and demand. When demand outstrips supply for a good, suppliers can charge a higher price. In 2023, that good was liquidity.
Private debt, and direct lending in particular, had a strong year both in terms of fundraising and performance as the availability of traditional debt financing channels continued to decrease, particularly after the regional bank crisis at the beginning of the year.1 Companies seeking debt capital turned to private sources more than ever before2 and, true to the age-old supply-and-demand principles, willingly paid a higher cost with greater restrictions.3
Direct lending is when a company borrows directly from a private source of debt capital instead of going to the public markets or a bank. Those loans are typically structured with floating rates, which means lenders get paid a base rate, typically the Secured Overnight Financing Rate (SOFR), plus some spread over SOFR. With base rates much higher this year than they were three years ago (which was basically zero) that meant the total yield on these loans became much more attractive (Exhibit 3). Fixed-rate bonds, which we think of as “traditional fixed income,” on the other hand, have had a negative reaction to higher rates.

Footnotes
Source: Guggenheim Investments, “High-Yield and Bank Loan Outlook Technical Support Remains Strong but Fundamental Pressures to Grow in 2024,” as of 6/20/2023.
Private credit has filled the gap left by traditional debt financing sources like the broadly syndicated loan market (Exhibit 3)
Direct lending has evolved from what used to be an expensive lender of last resort to a critical element of the capital markets. As such, it may be a more reliable option for companies of all sizes to borrow with increased certainty of execution. Certain companies could find this relative reliability, along with the benefit of sitting across the table and working with one or many lenders as partners, worth paying up for in today’s environment. Direct lending funds have appeared to benefit from this demand.
Private equity secondaries, a type of investment in which buyers of secondary fund interests supply liquidity to either existing LPs or GPs seeking to dispose of long-held assets or secure new financing for trophy assets, represented another area of the private market where liquidity suppliers were rewarded this year.4
In particular, the market conditions of the prior year motivated LPs to sell their stakes in an attempt to rebalance their portfolio. Because private market valuations typically lag the public markets, portfolios got out of sync, especially for those institutions that already had at or near target private market allocations before the public market sell off.5 Discounts on LP-led secondary deals widened, especially in venture secondaries where the median transaction during the first half of the year had a 69% discount to the last NAV and the median discount for buyout secondaries was the largest in years (Exhibit 4).
The private equity secondary market also comprises a GP-led segment, where GPs are increasingly seeking liquidity for their LPs on funds that may be running a bit long or when they seek to retain single trophy assets when conditions for selling them are less lucrative than they anticipated.6
Given valuation uncertainty, traditional exits like IPOs and M&A slowed. As a result, GP-led secondaries have been a rapidly growing part of the market, again demonstrating the growing demand for liquidity.

Footnotes
Source: Jefferies, H1 2023 Global Secondaries Market Review, July 2023
Large discounts relative to previous years persisted in private equity secondaries in 2023 (Exhibit 4)
3. “Lagging” Valuations in Private Markets May Allow Investors To Skip Dips in Public Equity Markets.
The public market went through a wild ride in 2023 as market participants flip flopped their expectations between certain recession and certain soft landing, depending on the Fed-led trajectory of interest rates.7 Meanwhile, the private markets stood still as buyers and sellers, capital raisers and capital deployers, held out on pricing until the dust settled (if they could).8
So which market—public or private—may be “right”?

Footnotes
Source: Bloomberg, Preqin, S&P 500 Index represented by the SPX Index, as of 12/8/23, Preqin Private Equity index represented by the Preqin Private Equity Index, as of 6/2023.
The downturn in private market valuations appeared to lag public markets as buyers and sellers waited for the dust to settle (Exhibit 5)
Though there’s no obvious answer here, what is clear is that neither public nor private market participants agreed on where critical macroeconomic factors would settle throughout 2023. That manifested as volatility in the public markets, alongside a dramatic slowdown of transactions in the private market that contributed to a “lag” in valuation corrections.9
Both public and private markets may benefit from greater certainty in macroeconomic factors in the coming year.
4. It May Be Time To Unlearn Some of the “Rules” of the Old ZIRP Paradigm.
In retrospect, the zero-interest-rate period (ZIRP) environment we all saw following the Global Financial Crisis was a historically anomalous period. A rising tide of liquidity lifted all boats, dispersion and volatility were abnormally low, and as a result, passive low-cost strategies were particularly attractive.10 That simply was not an environment that suited hedge funds and made it difficult to justify their costs. That paradigm has shifted once again.11

Footnotes
Source: HFRI, Hedge Funds represented by HFRI Fund Weighted Composite Index, Bloomberg, S&P 500 represented by S&P 500 Index, Fixed Income represented by Bloomberg Barclays US Aggregate Bond Index, 60/40 portfolio represented by 60% weighting to S&P 500 and 40% weighting to Fixed Income, Interest Rates represented by Federal Funds Target Rate Upper Bound Index, as of July 2023.
Hedge funds have historically performed better relative to traditional assets during higher interest rate periods (Exhibit 6)
Hedge funds broadly saw more attention in 2023 than they have in many years.12 That may be due largely to greater dispersion across asset classes, companies, global interest rates, and currencies in the higher-interest-rate environment.13 That kind of dispersion tends to be the lifeblood that drives the opportunity set for many hedge funds.
Historical data suggests that in “normal” interest-rate environments, hedge funds, as measured by the broad HFRI Index, outperformed the S&P 500 not just on a risk-adjusted basis but in nominal terms as well.
5. Correlations Aren’t Always Constant, but Diversification May Still Be the Only Free Lunch.
Correlation in the context of portfolio construction is how one asset class or strategy behaves relative to another. This concept really underpins Modern Portfolio Theory and the efficient frontier introduced by Harry Markowitz in the 1950s. The idea is that by combining assets with less-than-perfect correlated return streams, you can improve your portfolio’s total return for every unit of total portfolio risk.14 From there emerged the 60/40 portfolio, typically composed of 60% stocks and 40% bonds.
The trouble with correlation is that it’s not constant. When markets sell off, what one thought was a low or negative correlation between the assets in your portfolio can suddenly turn positive at the worst possible time. That’s what we saw with the 60/40 portfolio in 2022. Before that, many advisors relied on bonds to serve as the ballast to the traditional portfolio. The common wisdom was that when equities sold off, bonds would rally and provide downside protection. But during the sell-off in 2022, that was not at all the case.15
So, is the 60/40 dead? Not quite. Stocks and bonds are still critical elements of diversified portfolios. In fact, November 2023 was one of the best months for the 60/40 in years.16
Even so, we believe there is still a great deal of uncertainty ahead, and it would require a big leap of faith to assume that the defensive role of traditional fixed income will be as strong as it had been during other downturns historically. There’s just no guarantee that we will automatically return to a period of negative correlations between equity and bonds. When inflation is volatile, equity bond correlations are often positive like it was in the 70s, 80s, and 90s.17
A key feature of alternative investments is to provide diversification. Alternative investments, to different extents and depending on the asset class, strategy, and underlying assets, may provide diversified return streams and potentially help bolster a portfolio in different market conditions. Including these elements that may be able to hold up or react positively when others are failing may prepare portfolios for the uncertainty ahead.

Footnotes
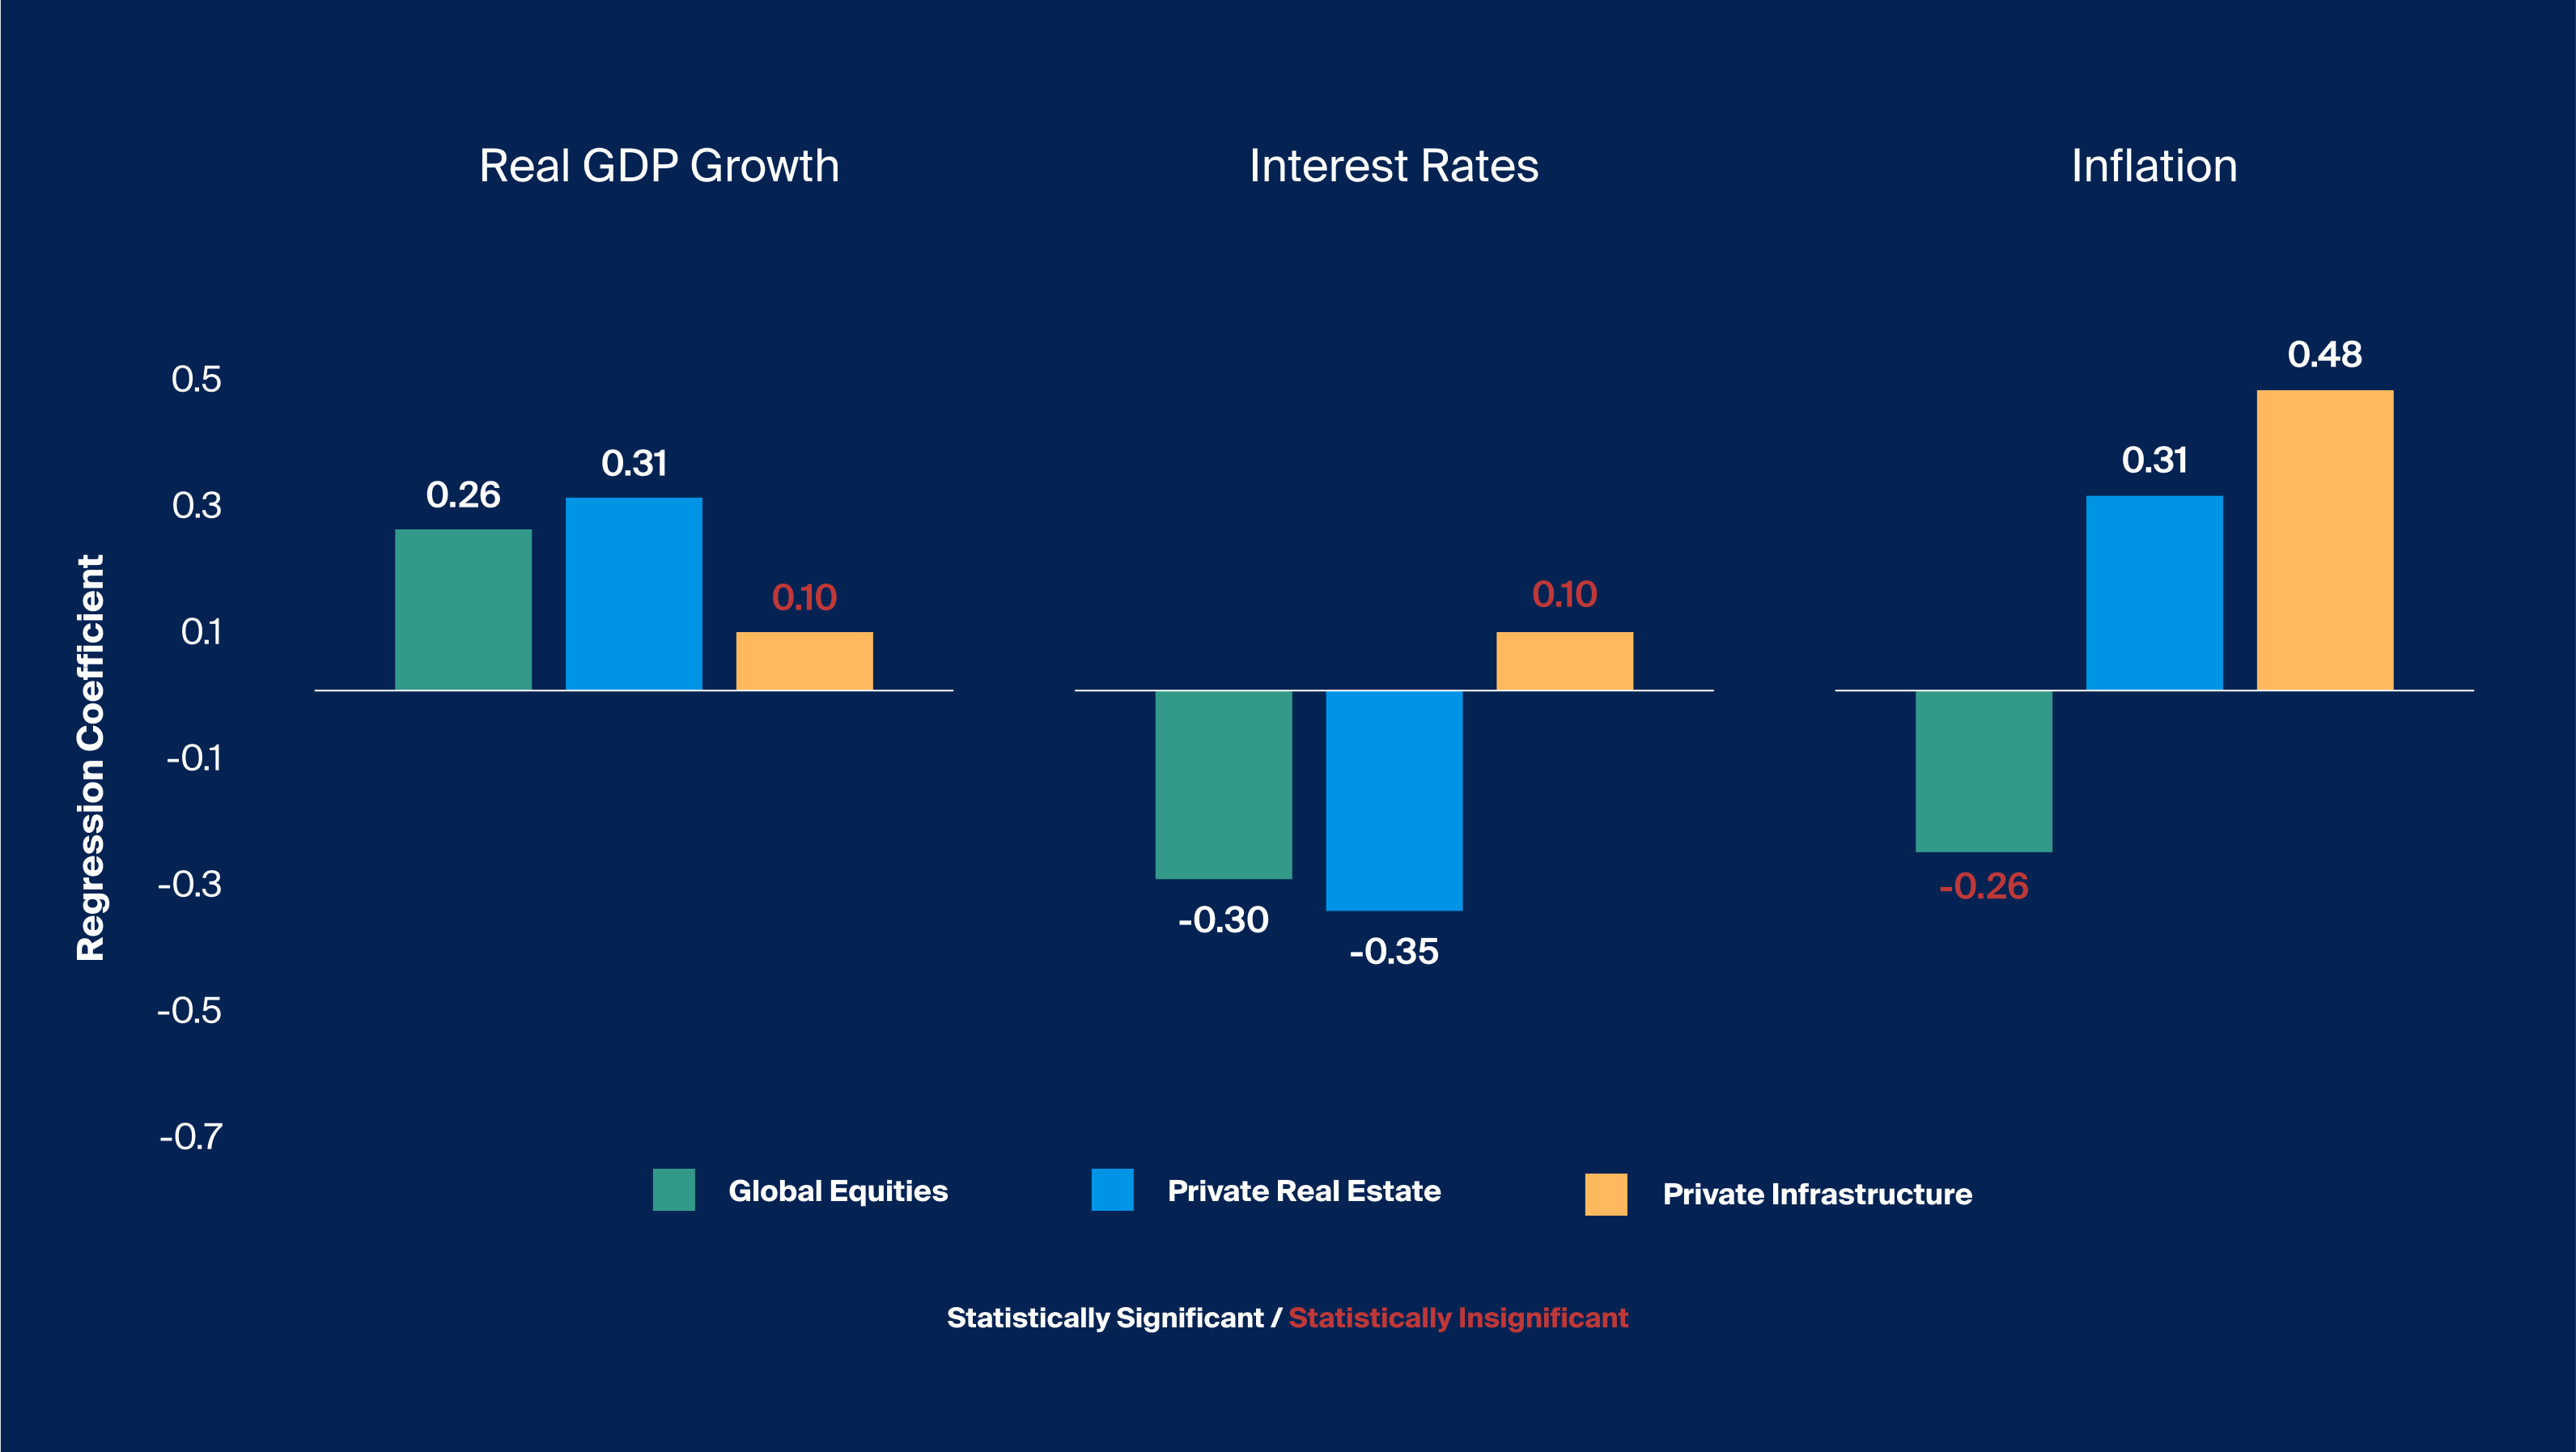
Source: Bloomberg, Preqin, Global Equities represented by MSCI World Index, Fixed Income represented by Bloomberg Barclays US Agg Total Return Value Unhedged Index, Private Real Estate represented by Preqin Real Estate Index, Private Infrastructure represented by Preqin Private Infrastructure Index, Real GDP Growth represented by GDP US Chained Dollars YoY SA, Interest Rates represented by US Generic Govt 10 Yr, Inflation represented by US CPI Urban Consumers YoY NSA, analysis conducted using excel regression using the three economic measures as independent variables, and GDP lagged three quarters, confidence interval of 95%, coefficients represent standardized regression coefficients, analysis conducted from March 2008 to March 2023. Note that it is not possible to invest in an index.
Private infrastructure has exhibited a greater positive relationship with US inflation compared to global public equities and private real estate in the last 15 years (Exhibit 7)
And alternatives are no longer exclusive to institutions. Now that they’re accessible to financial advisors across asset classes and strategies, a zero percent allocation—while it may actually be the right one—can now appear as an active decision not a passive omission for many advisors.
So as the late Harry Markowitz is attributed to saying, “diversification is the only free lunch.” That has not changed.
As they look to 2024, financial advisors may now consider these and other lessons from the past and seek to avoid making decisions for the future that are based on a seemingly outdated paradigm. Advisors can also choose to focus on what is in their control: strategic asset allocation and liquidity optimization. Each of these topics bears its own set of questions.
First, what assumptions did the advisor have when determining a portfolio’s current composition? Do those assumptions still hold? What tools are available today that were not available when the strategic asset allocation was first established? Moreover, if the efficient frontier could be redrawn with all of the asset classes and strategies now available to advisors today, how far under the curve does the current asset allocation fall?
It appears these types of conversations are happening more and more already. In a survey we conducted with Mercer this fall, we found that among advisors with current allocations to alternatives, 95% said they would have an allocation to alts over 5% by 2025. More than half of these advisors expect that their clients would have an allocation of 15% or more. In the coming year, which seems to be simultaneously pivotal and filled with uncertainty, it appears advisors are taking portfolio diversification beyond stocks and bonds very seriously.


