Our analysis indicates that manager selection has historically been more important when investing in alternative asset classes than in traditional investment funds; yet, when choosing an alternative asset manager, how much might the managers’ previous funds tell advisors about the prospects of the funds they consider today?
What You'll Learn
Performance dispersion has historically been higher within alternative asset classes than in traditional ones, such as public equity or fixed income, potentially indicating the importance of selecting top-performing managers when seeking higher returns.
In venture capital, when comparing funds to the previous fund in their series, top-quartile funds followed other top-quartile funds 40% of the time; 70% of the time, funds that followed a first-quartile performer ended up as above-median performers. Funds that followed bottom-quartile performers in a given vintage, on the other hand, landed in the bottom quartile 40% of the time.
In buyout, historical data suggests a similar pattern of persistence. Seventy percent of funds that followed a first-quartile performer generated an above-median return. Other studies have, however, demonstrated a waning of this pattern of persistence in more recent vintages.
Past performance is still no guarantee of future performance. Advisors should seek to conduct rigorous investment due diligence on managers’ businesses, teams, investment processes, and other important considerations.
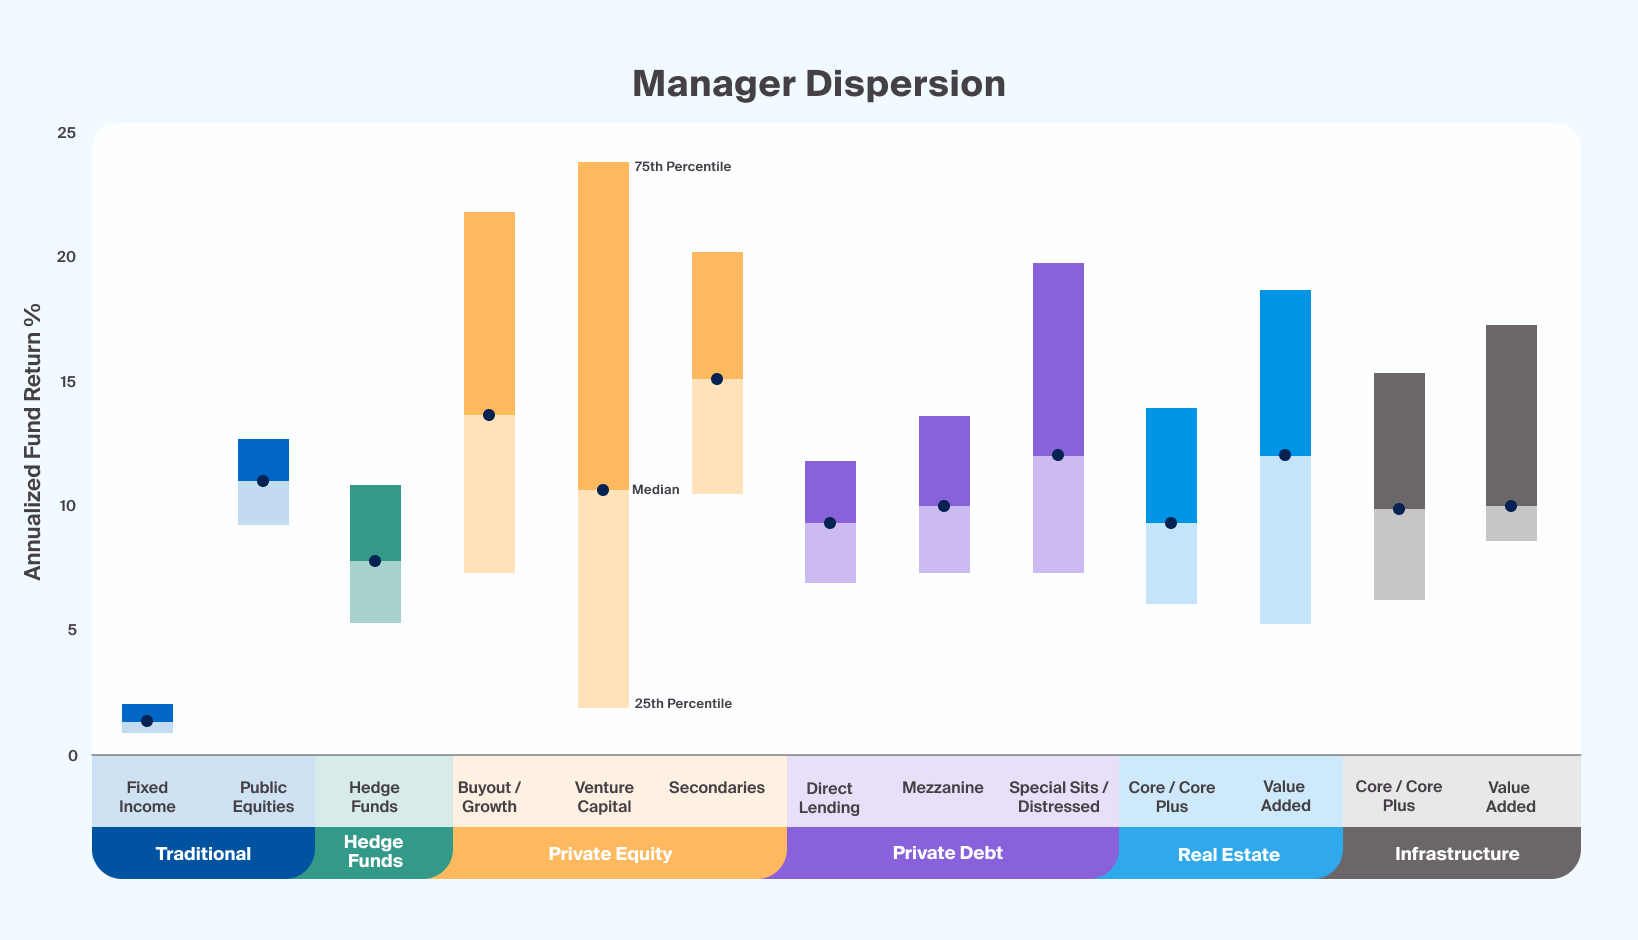
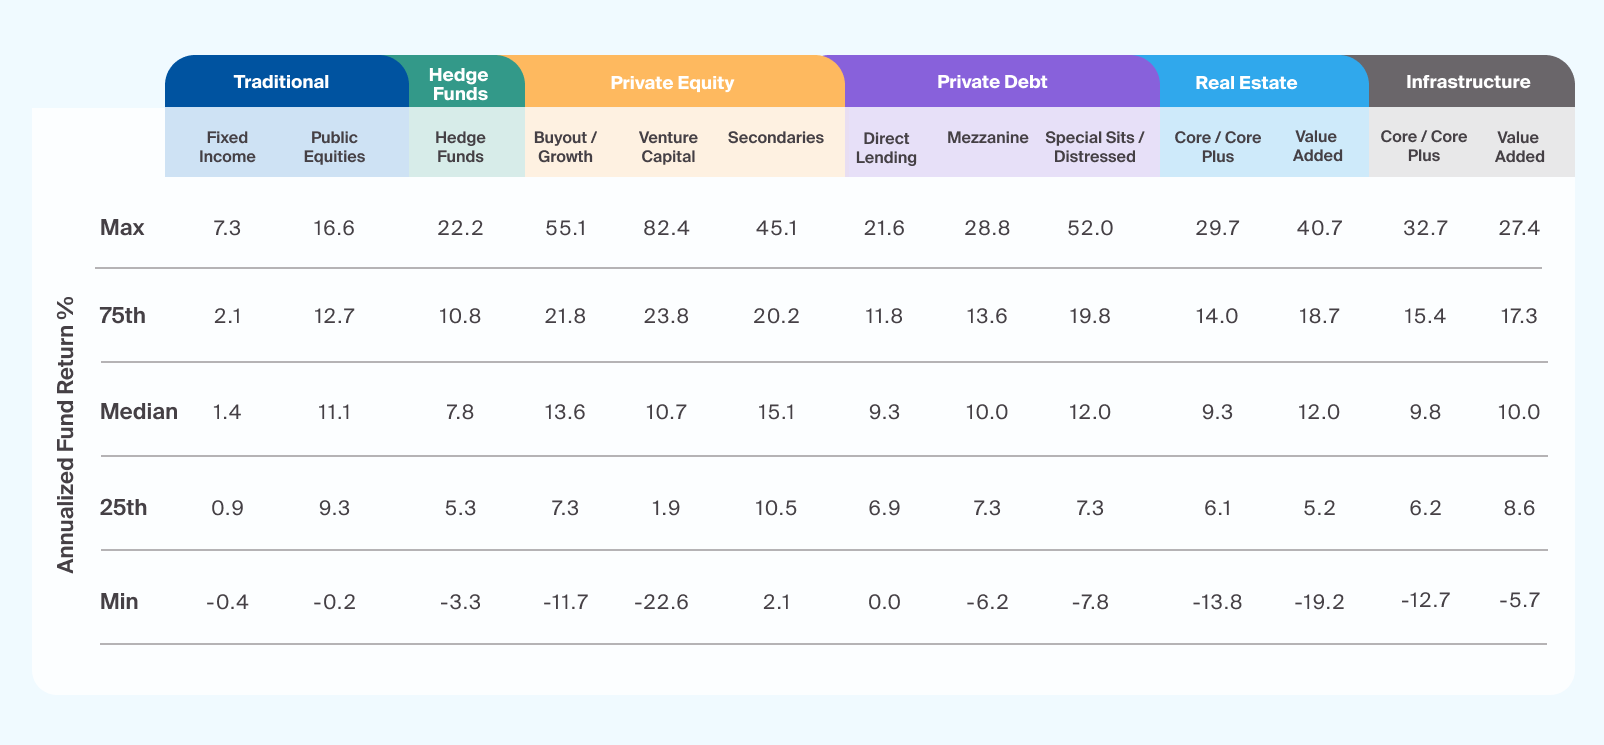
Accessing top-performing fund managers may be even more important when investing in alternative asset classes than in traditional asset classes, like public equities and traditional fixed income. Indeed, performance across alternative investment funds has historically been more widely dispersed than that of their traditional counterparts (Exhibit 1).

Footnotes
Source: Fund data trimmed by removing funds in the 2.5% return tails of each asset class depicted. Analysis is based on the remaining 95% of funds, capturing approximately 2 standard deviations from the median, assuming a normal distribution of fund returns. HFR, Constituents of the HFRI Composite measured by Rate of Return since 1990, the Hedge Funds category consists of Macro, Relative Value, Equity Hedge, and Event Driven. Preqin, Private Equity data represented by mature funds (minimum 10 years) and consists of Buyout, Venture, Growth, and Secondaries (minimum 7 years); Private Debt data represented by mature funds (minimum 3 years) consists of Direct Lending, Mezzanine, Special Situations and Distressed Debt; Real Estate, data represented by mature funds (minimum 10 years ) consists of Core, Core-Plus, Value-Added; Infrastructure data represented by mature funds (minimum 10 years) consists of Core, Core-Plus and Value Added. All returns measured by internal rate of return (IRR)% since inception of funds analyzed. Bloomberg, Fixed Income funds represented by US focused open-end funds, across Government, Municipal and Corporate. US Equity funds represented by open end funds, Large-cap and Small-cap strategies, and Global Equity funds represented by broad focus market cap classified funds. Return data is representative of 10-year annualized total returns, as of November 2022
Source: Fund data trimmed by removing funds in the 2.5% return tails of each asset class depicted. Analysis is based on the remaining 95% of funds, capturing approximately 2 standard deviations from the median, assuming a normal distribution of fund returns. HFR, Constituents of the HFRI Composite measured by Rate of Return since 1990, the Hedge Funds category consists of Macro, Relative Value, Equity Hedge, and Event Driven. Preqin, Private Equity data represented by mature funds (minimum 10 years) and consists of Buyout, Venture, Growth, and Secondaries (minimum 7 years); Private Debt data represented by mature funds (minimum 3 years) consists of Direct Lending, Mezzanine, Special Situations and Distressed Debt; Real Estate, data represented by mature funds (minimum 10 years ) consists of Core, Core-Plus, Value-Added; Infrastructure data represented by mature funds (minimum 10 years) consists of Core, Core-Plus and Value Added. All returns measured by internal rate of return (IRR)% since inception of funds analyzed. Bloomberg, Fixed Income funds represented by US focused open-end funds, across Government, Municipal and Corporate. US Equity funds represented by open end funds, Large-cap and Small-cap strategies, and Global Equity funds represented by broad focus market cap classified funds. Return data is representative of 10-year annualized total returns, as of November 2022
This is more apparent in venture capital, which invests in inherently riskier, early-stage companies. During the period that we measured this performance, those median or below-median funds generated returns below the median public equity fund, and the median buyout or growth equity fund, both of which tend to invest in relatively lower-risk, later-stage companies.
Instead, what seemed to make venture capital attractive during the measured period was the performance of above-median managers, particularly those in the first quartile.

Footnotes
Source: Fund data trimmed by removing funds in the 2.5% return tails of each asset class depicted. Analysis is based on the remaining 95% of funds, capturing approximately 2 standard deviations from the median, assuming a normal distribution of fund returns. HFR, Constituents of the HFRI Composite measured by Rate of Return since 1990, the Hedge Funds category consists of Macro, Relative Value, Equity Hedge, and Event Driven. Preqin, Private Equity data represented by mature funds (minimum 10 years) and consists of Buyout, Venture, Growth, and Secondaries (minimum 7 years); Private Debt data represented by mature funds (minimum 3 years) consists of Direct Lending, Mezzanine, Special Situations and Distressed Debt; Real Estate, data represented by mature funds (minimum 10 years ) consists of Core, Core-Plus, Value-Added; Infrastructure data represented by mature funds (minimum 10 years) consists of Core, Core-Plus and Value Added. All returns measured by internal rate of return (IRR)% since inception of funds analyzed. Bloomberg, Fixed Income funds represented by US focused open-end funds, across Government, Municipal and Corporate. US Equity funds represented by open end funds, Large-cap and Small-cap strategies, and Global Equity funds represented by broad focus market cap classified funds. Return data is representative of 10-year annualized total returns, as of November 2022.
Return enhancement over public equity funds was found predominantly above the median
The 75th percentile venture capital fund—which marks the division between first-quartile and second-quartile managers—outperformed the median VC fund by 13.1 percentage points on an IRR basis, while the median fund generated an 8.7 percentage points higher return than the 25th percentile fund. Fourth-quartile venture funds appeared particularly unrewarding, returning between 1.9% to -22.6% (Exhibit 2). Picking a better-than-median manager contributed to achieving return goals.
Of course, selecting a top-performing fund is easier said than done. Advisors may look to past performance to ascertain whether a manager can potentially produce another. But how often does performance really persist in private market funds?
According to a 2018 study, in the mutual fund industry, which typically invests in more traditional fixed income and public equity, returns have tended to revert to the mean over longer holding periods.1 Top-performing funds in any given period were likelier to be bottom performers in a previous period, and vice versa.2 Are the private markets any different?
Does Performance Persist in Private Equity?
In the following analysis, we observe potential patterns in the performance rankings of sequential funds from the same asset managers in both venture capital and private equity buyout. Our dataset includes all mature funds, which we define as having a vintage age of 10 years or more, in the Preqin database that are identified as being part of a fund series. We excluded any funds for which performance-based quartile rankings were unavailable via Preqin.
It’s worth noting that we use the ultimate performance of mature private market funds. Such data comes with the benefit of hindsight that an allocator certainly does not have when deciding to commit to a new vintage in a fund series. Indeed, given the nature of private markets investing, an advisor who wishes to recommend the next private markets drawdown fund in a series generally must do so only partway through the life of the manager’s previous fund. As such, only the interim performance of that previous fund is available. However, a recently published study by Harris et al. suggests that for certain private equity strategies, this interim performance may not effectively indicate persistence and may only provide a noisy signal.3
Indications of Performance Persistence in Venture Capital
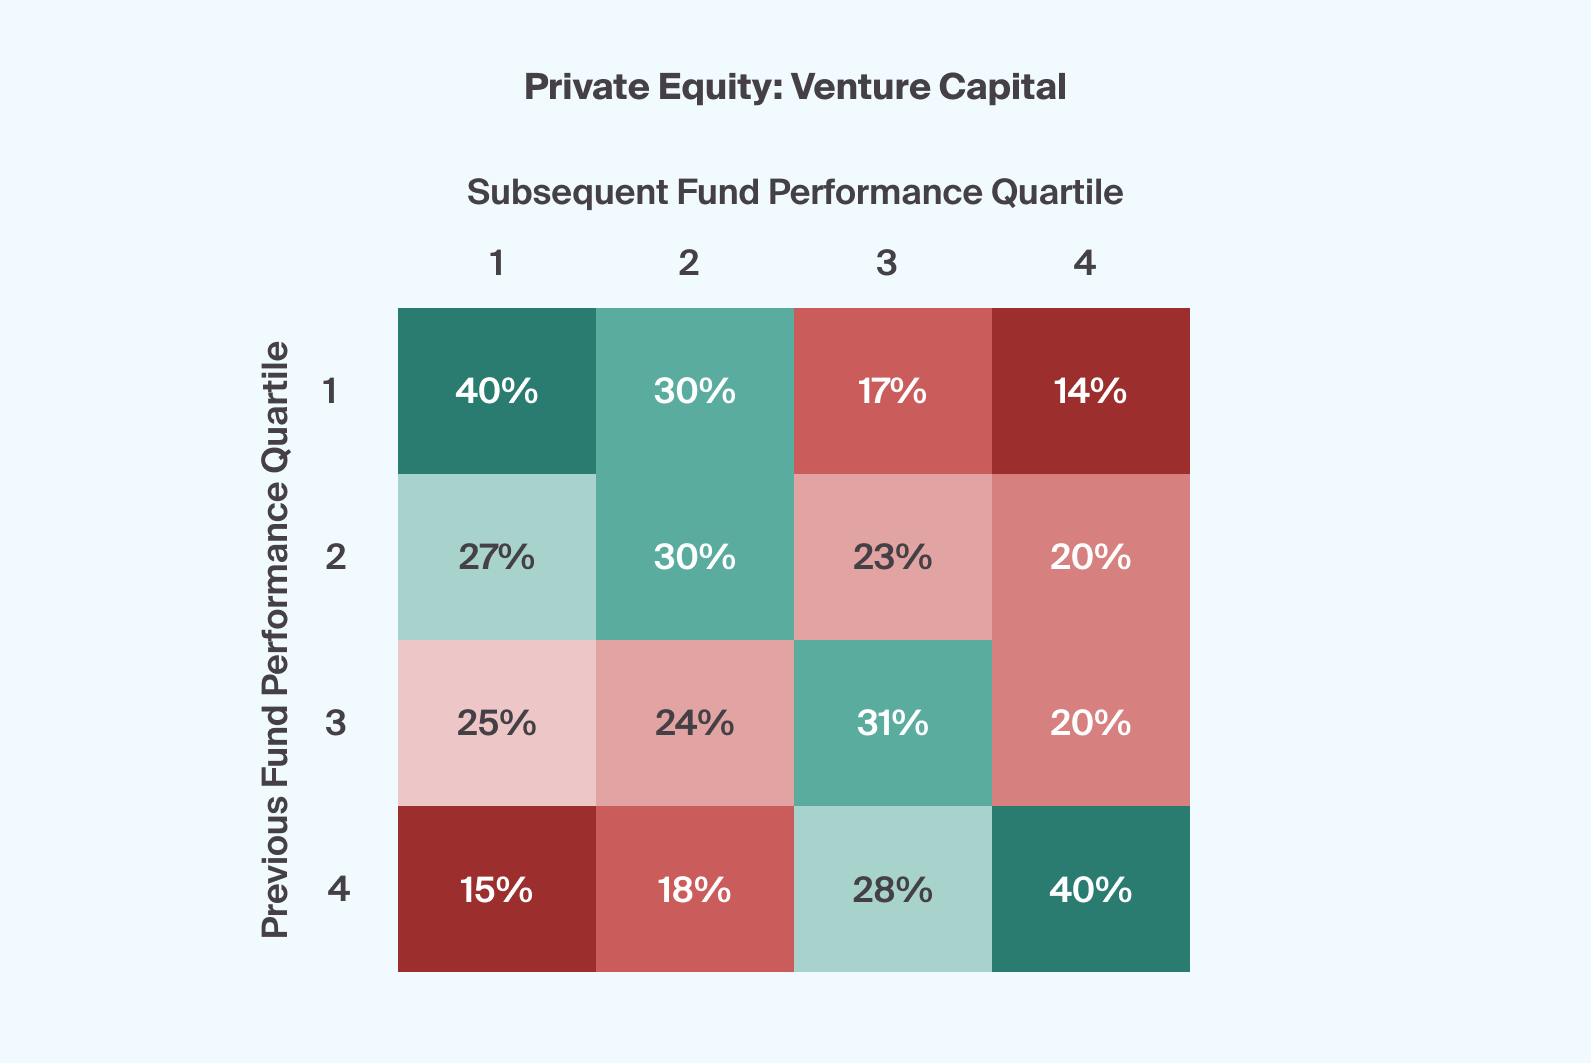
We summarize the frequency of subsequent fund performance rankings for venture capital in Exhibit 3. If managers’ performance did not show signs of persistence, then we would expect to see that the performance of a previous fund in a series would not significantly impact subsequent funds’ performance rankings. In other words, the performance of any subsequent funds would be random and evenly distributed—roughly 25% in each quartile. We do, however, see a pattern that suggests persistence.

Footnotes
Source: Preqin; includes all Preqin Venture Capital funds from 1969 to 2013 identified with a Fund Series and Fund Series number. Quartile is Preqin Quartile Rank, a ranking based on a comparison against a larger sample size of peers that have reported performance within the most-up-to date range. As of July 31, 2023
Source: Preqin; includes all Preqin Venture Capital funds from 1969 to 2013 identified with a Fund Series and Fund Series number. Quartile is Preqin Quartile Rank, a ranking based on a comparison against a larger sample size of peers that have reported performance within the most-up-to date range. As of July 31, 2023
Conventional wisdom suggests that the best-performing venture capital firms should be able to maintain their outperformance as their reputations may enable them to access and win the most attractive and competitive deals—in turn, bettering their reputations and so on in a virtuous cycle.4 The data seems to support that intuition.
Of funds that followed top-quartile funds, 40% were also top-quartile performers, while 70% performed above their vintage median. Conversely, funds that followed fourth-quartile funds performed below the median 68% of the time. Only about a third of funds that followed fourth-quartile funds breached the top half of performers in their given vintage.
Other admittedly more rigorous studies have suggested the same; performance persistence in venture capital may indeed come down to deal flow access.5 Interestingly, the same study mentioned previously by Harris et al. found that, in venture capital in particular, even interim performance of the previous fund at the time of fundraising—data that an investor would have at the time of assessing whether to commit to a new fund—demonstrated persistence.6
Indications of Performance Persistence in Private Equity Buyout
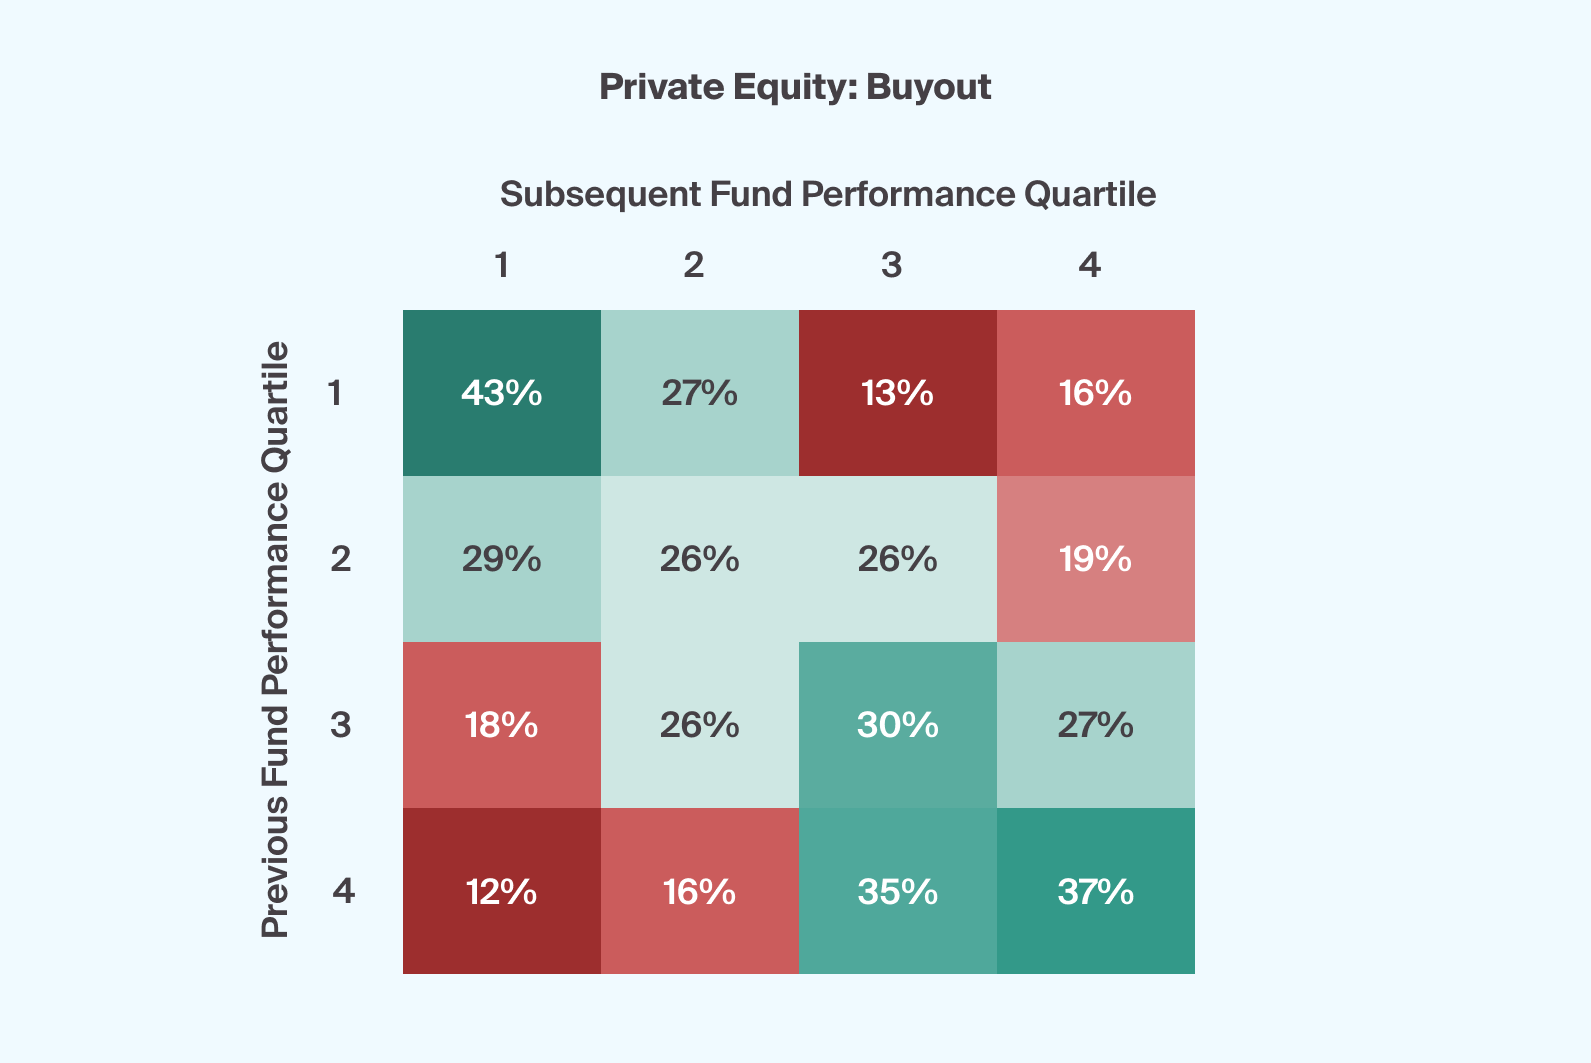
Did buyout funds demonstrate the same degree of performance persistence? At first glance, yes. For buyout funds that followed a first-quartile performer in the previous vintage, 43% repeated the first-quartile ranking. Meanwhile, 70% of the subsequent funds generated an above-median return. Only 30% of funds that followed a first-quartile fund in a vintage series generated a below-median return for their given vintage year.
Funds in a series that followed a second-quartile-performing fund only skewed slightly positive, with 55% generating above-median performance. And finally, funds that followed fourth-quartile funds tended to rank in the bottom quartile of their vintage 37% of the time. Roughly 72% of the time, these subsequent funds performed below the median.

Footnotes
Source: Preqin; includes all Preqin Private Equity Buyout funds from 1977 to 2013 identified with a Fund Series and Fund Series number. Quartile is Preqin Quartile Rank, a ranking based on a comparison against a larger sample size of peers that have reported performance within the most-up-to date range. As of July 31, 2023.
Source: Preqin; includes all Preqin Private Equity Buyout funds from 1977 to 2013 identified with a Fund Series and Fund Series number. Quartile is Preqin Quartile Rank, a ranking based on a comparison against a larger sample size of peers that have reported performance within the most-up-to date range. As of July 31, 2023.
Nonetheless, past performance has proven to be far from a guarantee of future results. According to the study referenced previously, while buyout performance showed strong signals of persistence pre-2000—and in the aggregate history of buyout funds as per Preqin (Exhibit 4)—that persistence did not hold for post-2000 buyouts.7 In contrast with VC, any interim buyout fund performance data that was available during the fundraising of a subsequent fund in a series had no statistical bearing on that second fund’s ultimate fund performance.8
Performance Persistence Is Still No Guarantee in Private Equity
There are some nuanced lessons here, along with others that reinforce common wisdom. First, an advisor should still aim to identify the best managers. Private equity fund managers have demonstrated some degree of persistence in maintaining their peer performance rank from vintage to vintage in a fund series. Historically, this has been true, particularly for top and bottom-quartile funds and especially in venture capital, where manager selection appears to matter more given the wide dispersion of historical returns observed in the asset class. As such, being able to access first and second-quartile managers can be critical when turning to private equity or venture capital for enhanced portfolio returns.
Selecting a fund based just on the merit of the performance of previous funds in a vintage series can leave too much up to chance. Understanding how and why a manager may (or may not) continue to produce high relative returns may help to narrow the odds. To do so, advisors may seek to conduct additional rigorous investment due diligence on the manager’s business management, team, investment process, and other important considerations.


