We previously analyzed the importance of building well-diversified portfolios that include assets with low correlations, but just how much does diversification across time really matter? When investing in private markets, is it enough to just identify great managers?
What you’ll learn:
Vintage diversification may be beneficial in private market investing because of the wide dispersion of returns from vintage to vintage.
Allocating only to a single vintage—even when allocating to a top-performing fund in that vintage—would have historically led to a wide range of outcomes.
Performance dispersion across vintages has been wide enough in certain asset classes, such as venture capital, for example, that funds ranked at the 25th percentile have beaten 75th percentile funds of other vintages. This dispersion may demonstrate the potential limitations of manager selection as the primary contributor to performance.
Timing may make a meaningful contribution to the ultimate performance of a vintage, but since timing can be difficult for some, advisors might consider a commitment pacing program to diversify across vintages.
For advisors ready to recommend an investment strategy that includes allocating their clients’ assets to private markets, it may be tempting to identify and invest a one-time, lump sum into a single fund. Hopefully, after careful diligence, they may assume that the managers they select have the skill and experience to invest effectively over the investment period. This can inherently limit some market timing risk since managers typically deploy capital over the course of a few years. The advisor, meanwhile, would only need to research and select a single fund to meet the client’s allocation target. As simple as that may seem, such a concentrated approach may be problematic.
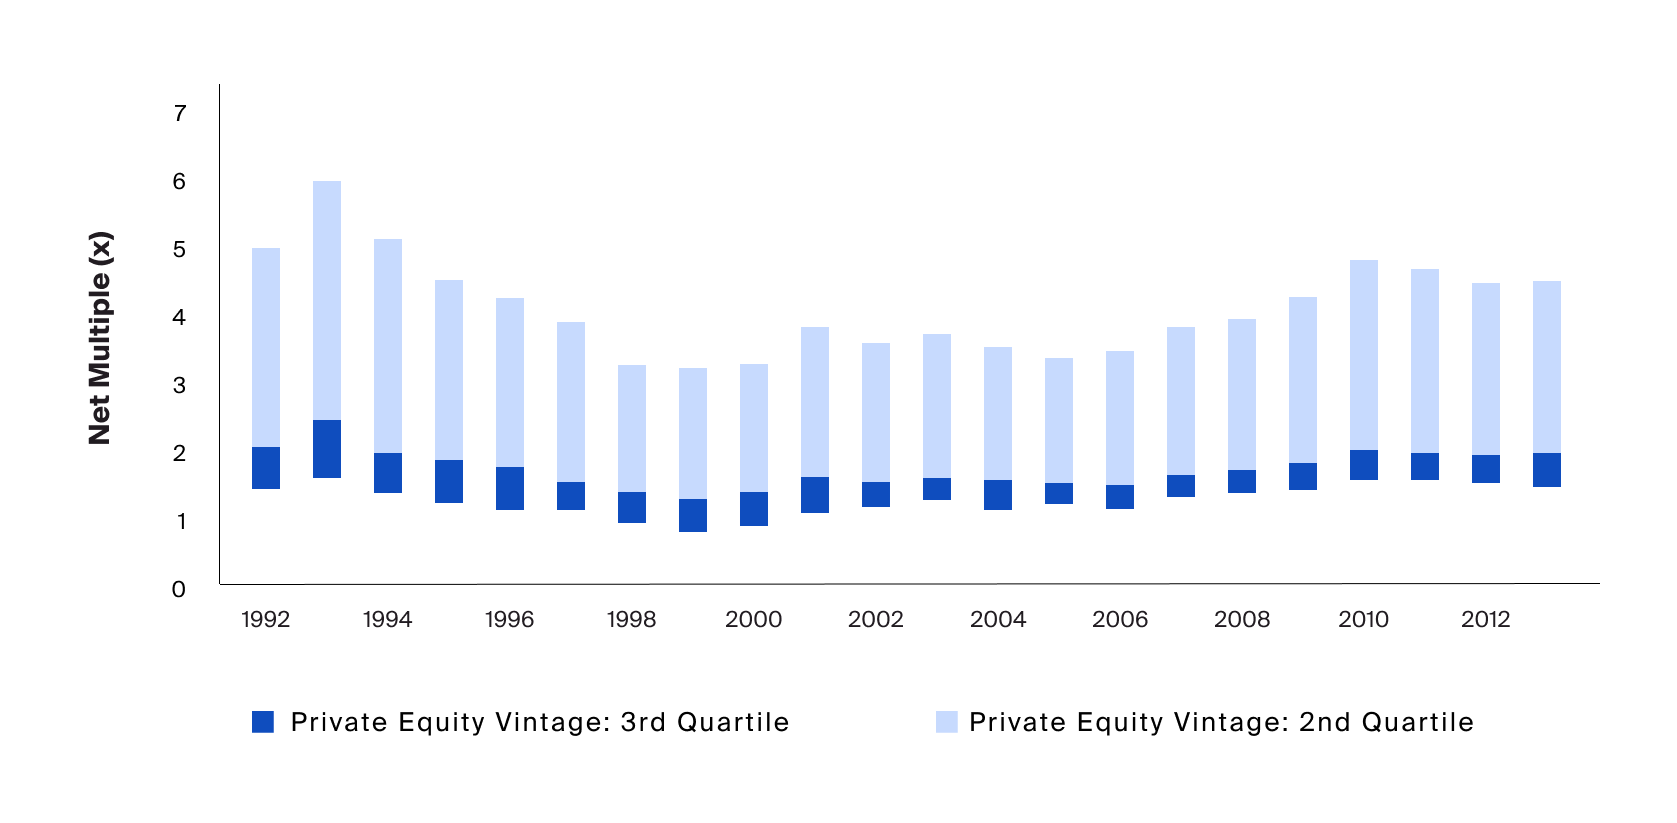
The performance of private market funds (including private equity funds) has historically fluctuated across vintages (Exhibit 1). Advisors, therefore, should be mindful of not only selecting quality managers, which has proven to be important, but also deciding when to make those commitments. In short, it’s not just what you invest in that matters, but in some cases—and in some private markets asset classes in particular—when you invest that can also contribute to performance, among other factors.
Once capital is committed, private market managers managing closed-end funds are generally subject to the market environments into which they must invest, and to some extent, the environment in which they exit, to realize returns. To employ their value-creation strategies and see their investments play out within their fund’s lifetime, they generally deploy their fund’s capital within a period of a few years and must exit investments by the end of a finite period. Timing the market can be difficult on both ends and even more so within these relatively short windows.
Therefore, instead of trying to find the right entry point for a single allocation, an advisor attempting to reach a target allocation to private markets may find it more beneficial to implement and adhere to a commitment pacing program. In fact, many private market portfolios typically include funds of varying maturities, which may assist in mitigating the risk of overconcentration to a single vintage year.1 One might think of such a program as the dollar-cost-averaging equivalent to private markets investing.

Source: Preqin, Private Capital Benchmarks, Private Equity – All (1992 – 2013), Vintage Years were selected starting the year in which Preqin provides greater than or equal to 20 funds in a given vintage, and ending in 2013 to only include mature funds as defined by fund incepted 10 years or greater, Net Multiple (X) Median, Top Quartile Boundary (Q1), Bottom Quartile Boundary (Q3), as of Most-Up-to-Date, on 1/5/2023.
The performance of private market funds has historically fluctuated across vintages. Advisors, therefore, should be mindful of not only selecting quality managers, which has proven to be important, but also deciding when to make those commitments. In short, it’s not just what you invest in that matters, but in some cases—and in some private markets asset classes in particular—when you invest that can also contribute to performance, among other factors.
In our analysis below, we explore the historical impact of vintage diversification in private markets. To gauge its utility in relation to manager selection, we control for fund selection within each vintage, assessing relative performance of funds at the 25th percentile, median, and 75th percentile across mature vintages, during a 22-year period between 1992 and 2013. To understand whether vintage timing matters more for certain private markets asset classes, we compare our analyses across buyout, venture capital, and private real estate.
Performance Dispersion Across Vintage Years
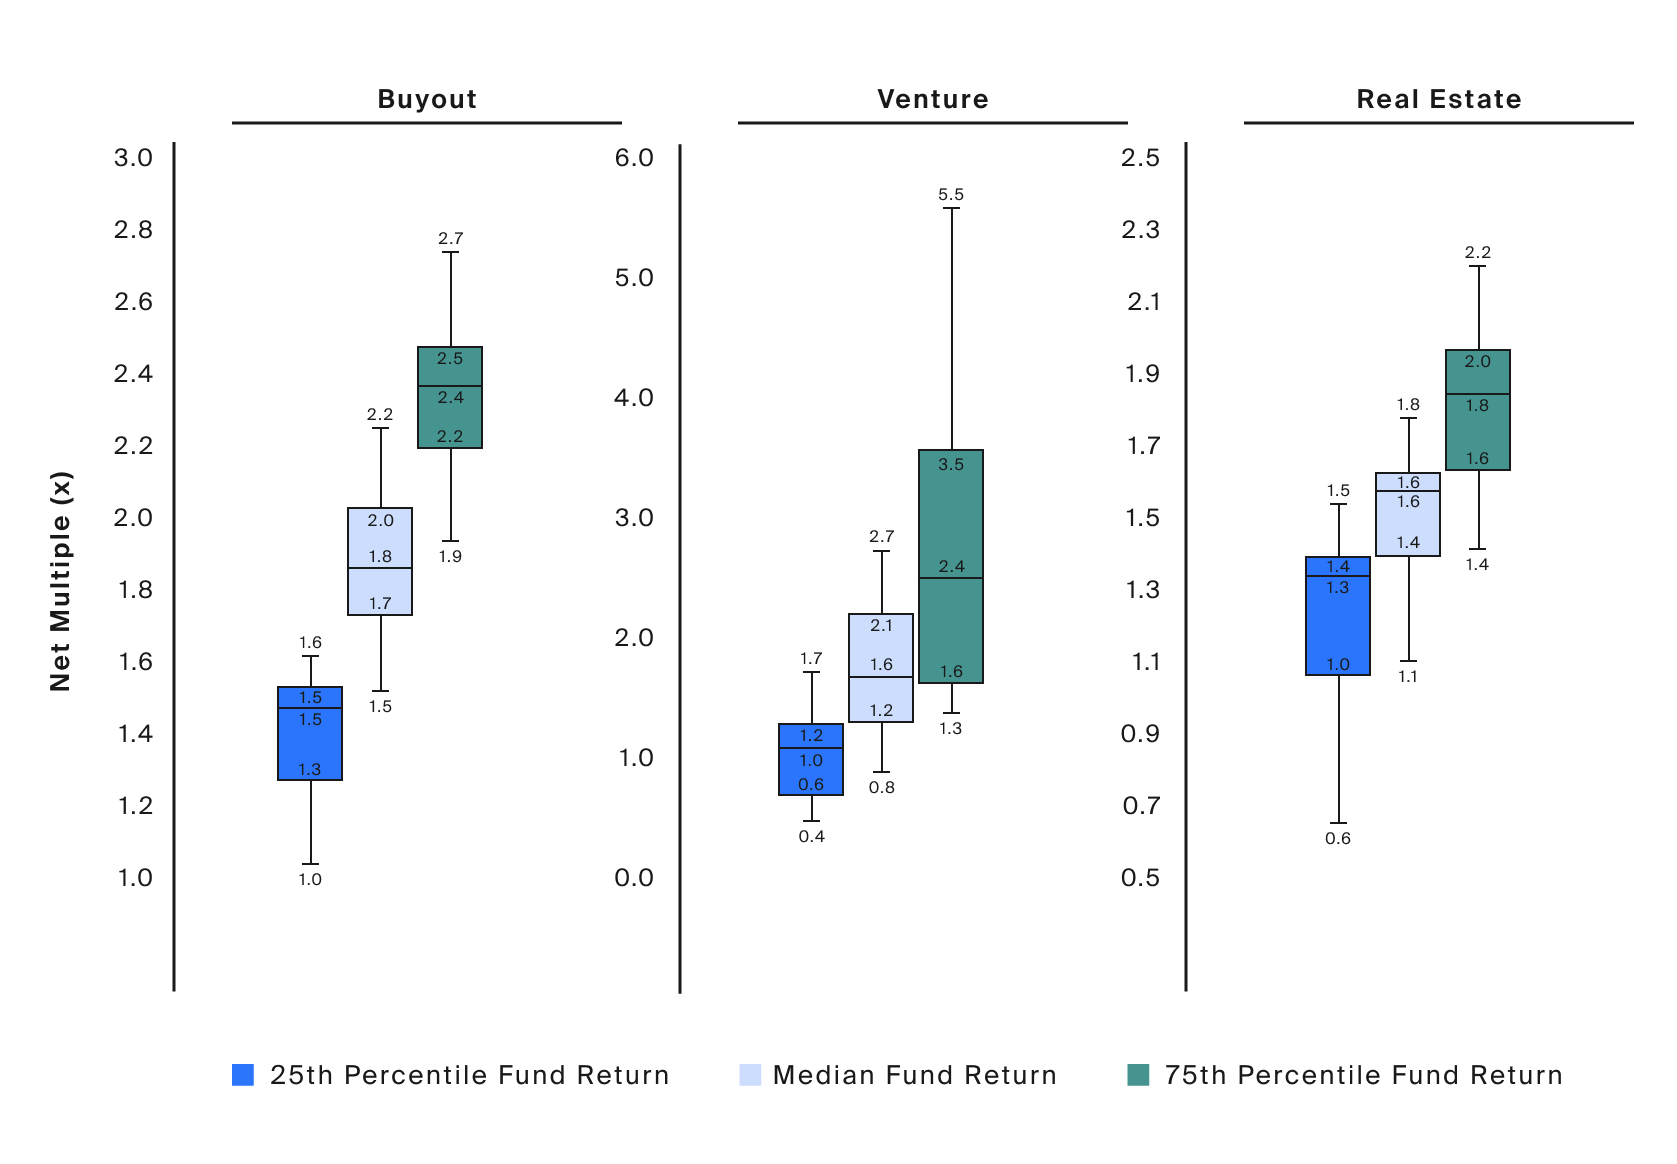
We started our analysis by using box and whisker plots to measure the dispersion, or range of net multiples achieved, at varying peer performance levels within a given vintage. We find that with peer performance held constant, funds from one vintage may have delivered very different returns compared to those from other vintages. We see that dispersion especially in the 75th percentile peer performance level in venture capital.

Source: Preqin, Private Capital Benchmarks, Buyout – All (Vintage Years 1992 – 2013), Venture – All (Vintage Years 1992 – 2013), Real Estate – All (Vintage Years 1995 – 2013), Vintage Years were selected starting the year in which Preqin provides greater than or equal to 20 funds in a given vintage, and ending in 2013 to only include mature funds as defined by fund incepted 10 years or greater, Net Multiple (X) Median, Top Quartile Boundary (Q1), Bottom Quartile Boundary (Q3), as of Most-Up-to-Date, on 1/5/2023.
For both buyout and real estate strategies, we saw significant but relatively even dispersion within peer groups across vintages, with spreads ranging from 0.6x to 0.9x. For venture strategies, dispersion across vintages was significantly wider. Funds at the 75th percentile generated a net multiple as low as 1.3x and as high as 5.5x. Like in buyout, the higher the peer performance level, the wider the range of outcomes across vintages: 4.2x for 75th percentile, 1.9x for median, and 1.3x for 25thpercentile funds.
For both buyout and real estate strategies, we saw significant but relatively even dispersion within peer groups across vintages, with spreads ranging from 0.6x to 0.9x (Exhibit 2). For venture strategies, dispersion across vintages was significantly wider. Funds at the 75th percentile generated a net multiple as low as 1.3x and as high as 5.5x. Like in buyout, the higher the peer performance level, the wider the range of outcomes across vintages: 4.2x for 75th percentile, 1.9x for median, and 1.3x for 25th percentile funds (Exhibit 2).
A key takeaway here may be that even if an advisor managed to select a fund that performed relatively well for that vintage year, they might have experienced a wide range of outcomes depending on the vintage year of the fund they chose.
Why Effective Manager Selection May Not Be Enough
In Exhibit 2 above, tails across peer groups in the box and whisker plots overlapped. This overlap not only emphasizes the wide range of performance dispersions but may indicate that there were instances of lower peer performance groups achieving similar or better performance than higher peer performance groups across vintages.
But, how often did the 75th percentile fund of one vintage produce a return as low as, if not lower than, the median fund or even 25th percentile fund of another vintage? These instances underline the fact that simply choosing a high-performing private markets manager or fund in a given vintage may not be entirely sufficient in achieving clients’ target outcomes.
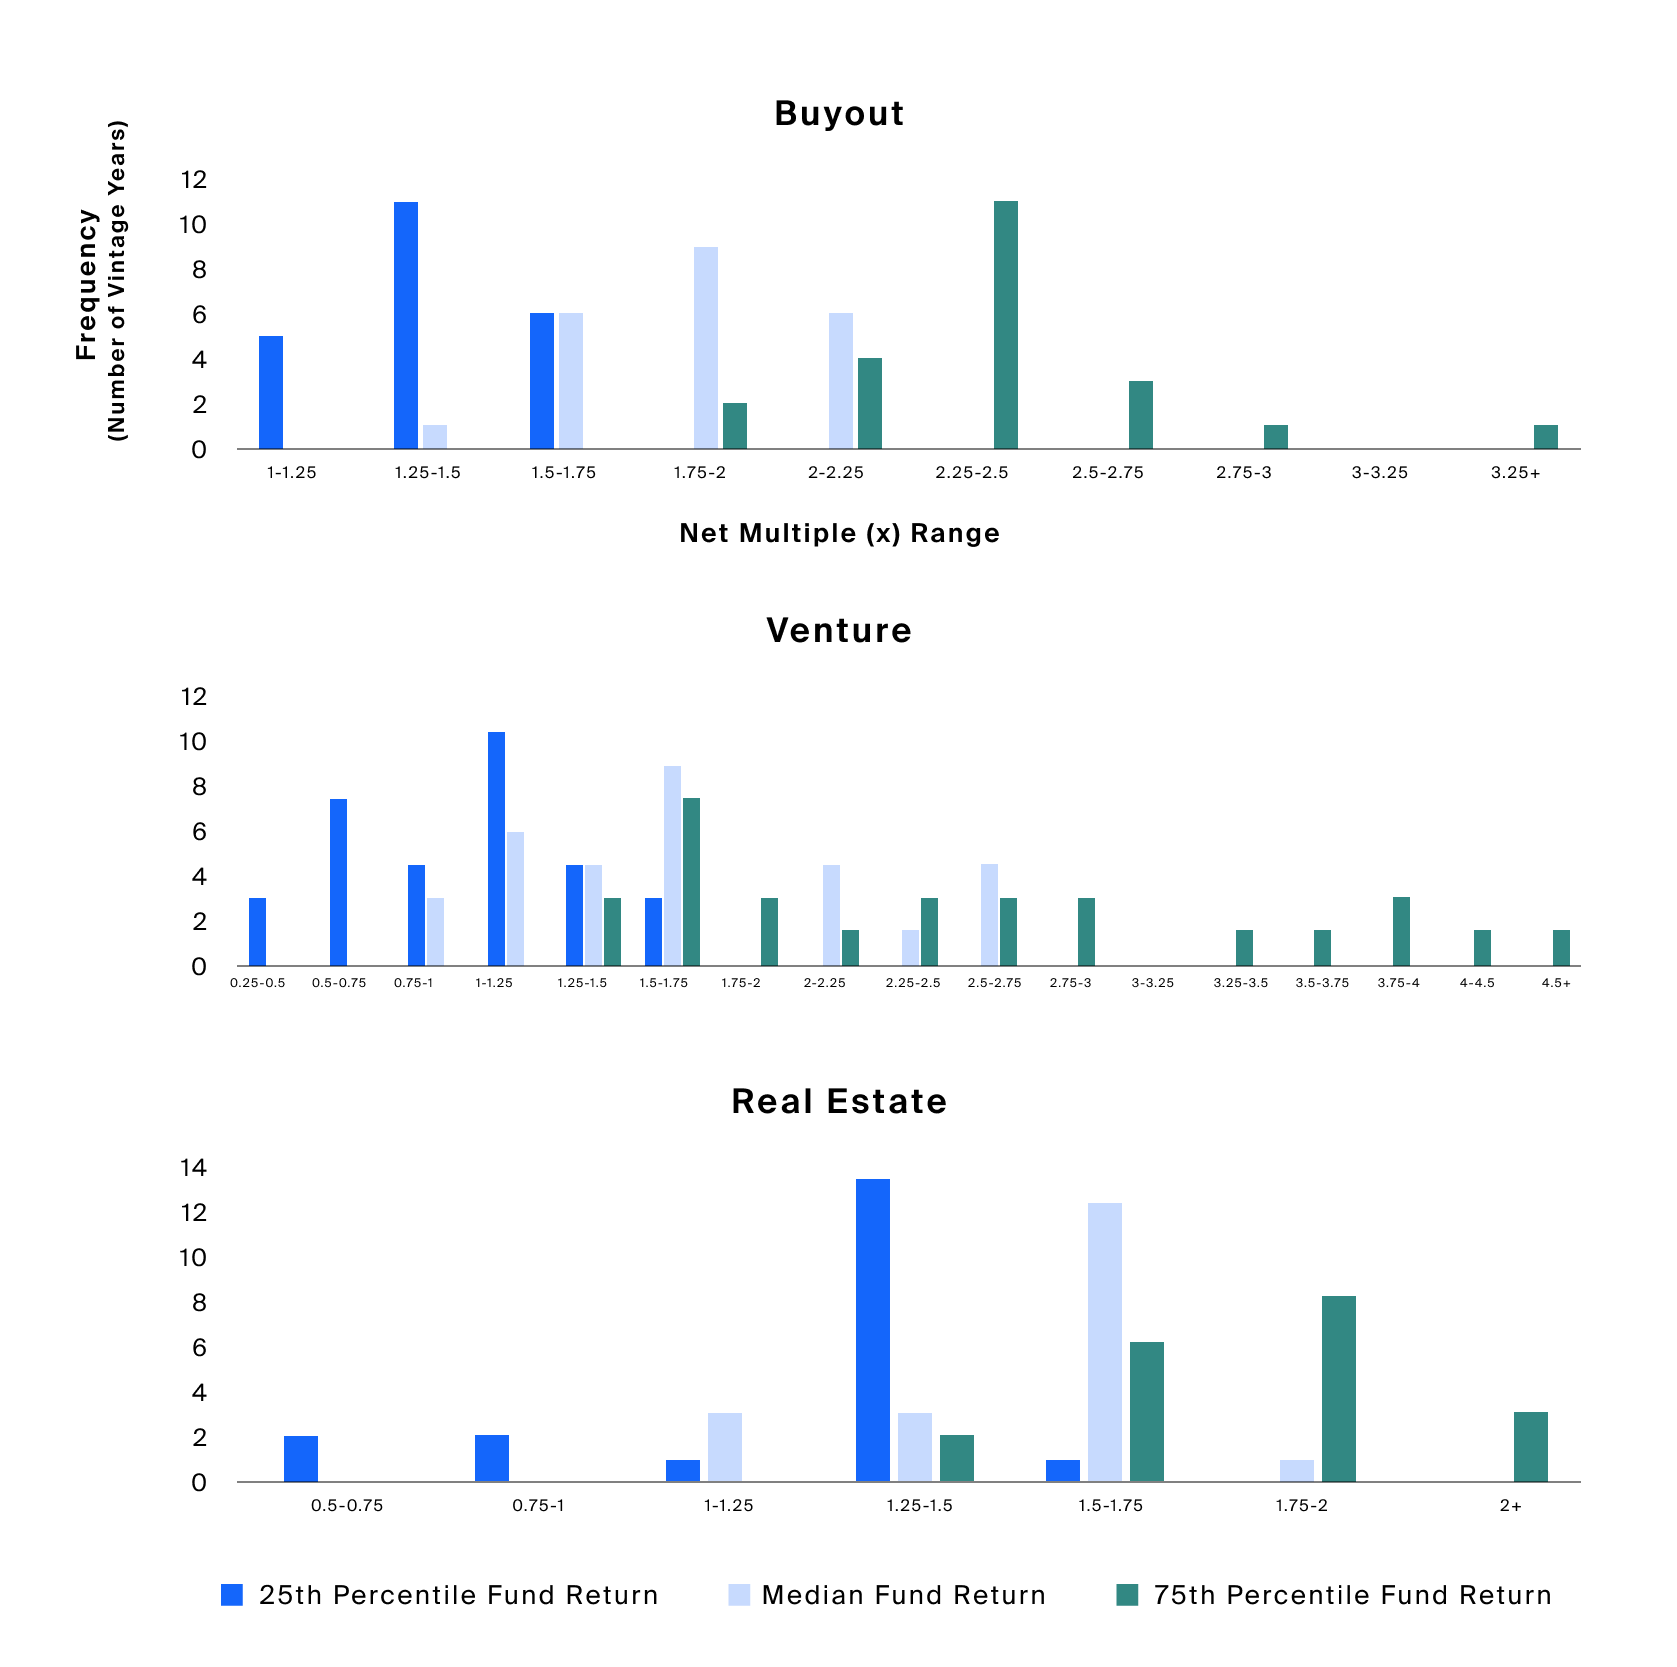
The following charts categorize the ranges of vintage performance frequency, summing the number of vintages that generated a net multiple in that given range. Overlaps between peer performance groups may indicate that manager selection may only get you so far in achieving a desired performance outcome.

Source: Preqin, Private Capital Benchmarks, Buyout – All (Vintage Years 1992 – 2013), Venture – All (Vintage Years 1992 – 2013), Real Estate – All (Vintage Years 1995 – 2013), Vintage Years were selected starting the year in which Preqin provides greater than or equal to 20 funds in a given vintage, and ending in 2013 to only include mature funds as defined by fund incepted 10 years or greater, Net Multiple (X) Median, Top Quartile Boundary (Q1), Bottom Quartile Boundary (Q3), as of Most-Up-to-Date, on 1/5/2023.
For buyout, out of 22 vintages, there were no instances where a 75th percentile fund generated a net multiple in the same performance range as a 25th percentile fund across other vintages. However, there were multiple instances in which median funds matched or outperformed 75th percentile funds or 25th percentile funds outperformed the median fund of other vintages.
For buyout, out of 22 vintages, there were no instances where a 75th percentile fund generated a net multiple in the same performance range as a 25th percentile fund across other vintages. However, there were multiple instances in which median funds matched or outperformed 75th percentile funds or 25th percentile funds outperformed the median fund of other vintages (Exhibit 3).
Venture demonstrated an even greater overlap across peer group outcomes. Out of 22 vintages, there were seven vintages in which 75th percentile funds ultimately performed in the same range as five of the 25th percentile funds from other vintages (Exhibit 3).
In real estate, while performance dispersion across vintages was relatively lower, the ultimate performance of peer groups was much more concentrated within specific ranges. For example, there were only two instances of 75th percentile funds generating a net multiple between 1.25-1.5x—the range at which the majority (13 out of 22) of 25th percentile funds ultimately performed. However, there was still an overlap in outcomes between median and 75th percentile funds across vintages (Exhibit 3).
Even if one managed to allocate to a “better” fund within a given vintage, historically, it was possible (especially in venture) to underperform a “worse” fund in a different vintage. This underlines the fact that combining manager selection with vintage diversification may help to mitigate the risk of allocating to an underperforming vintage and may better enable an investor to achieve their desired return objectives.
Intersecting Performance Dispersion and Frequency
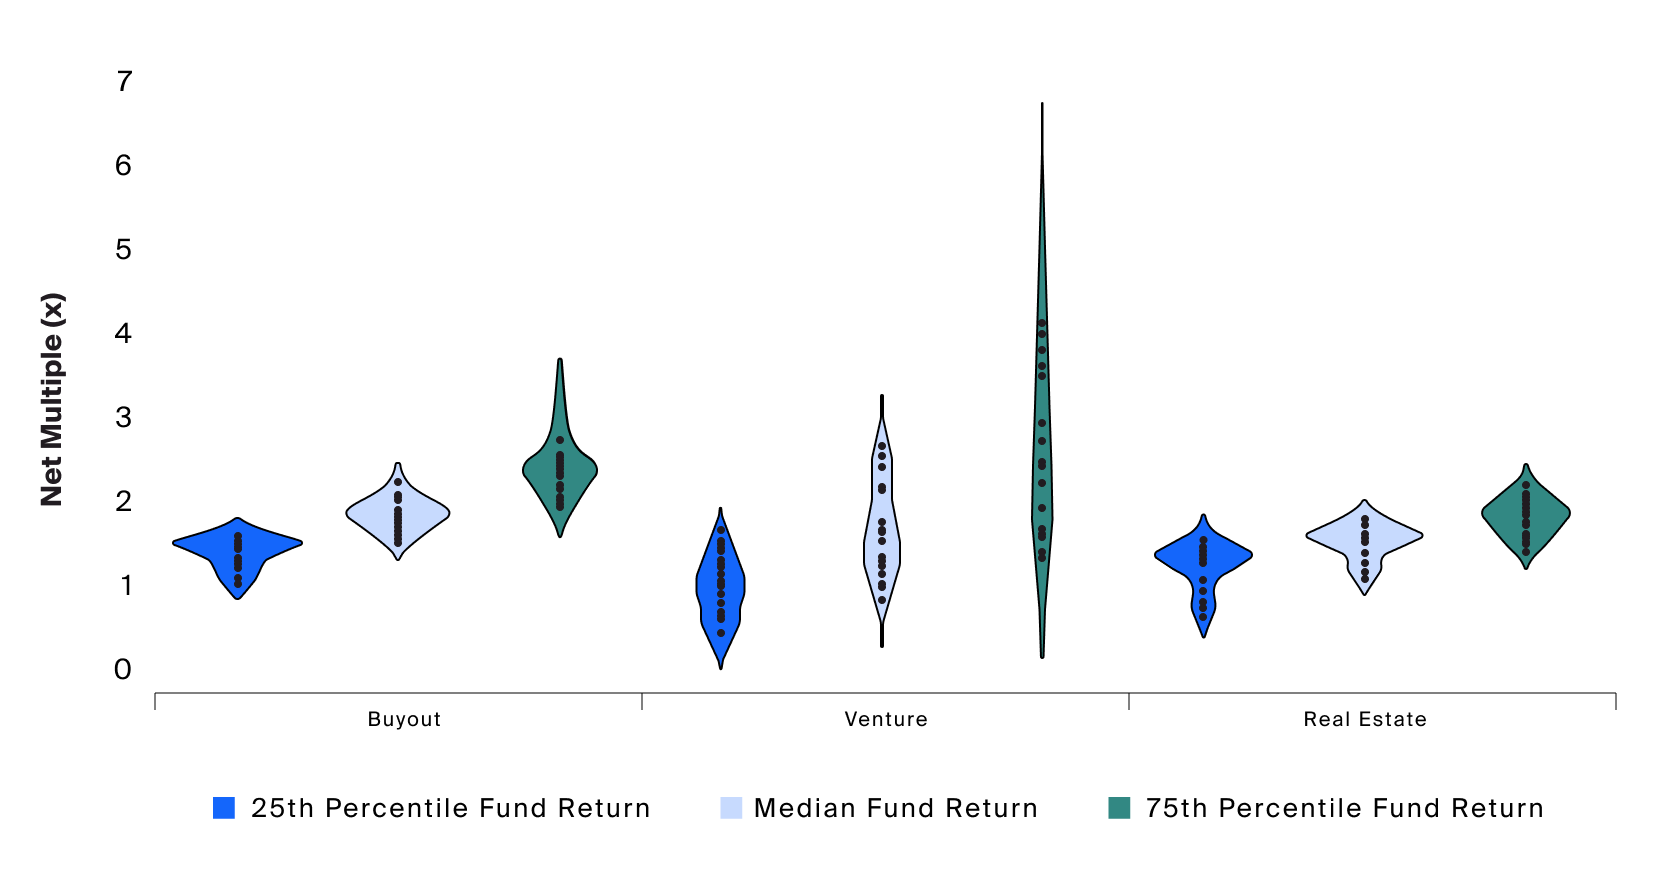
Combining both performance dispersion and frequency of outcomes across vintages produces the “shape” of vintage returns for each of the peer performance levels and for each of the strategies, in what is known as a violin plot. Wider regions depict greater density, i.e., more frequent outcomes, in that range. Longer violins indicate higher dispersion.

Source: Preqin, Private Capital Benchmarks, Buyout – All (Vintage Years 1992 – 2013), Venture – All (Vintage Years 1992 – 2013), Real Estate – All (Vintage Years 1995 – 2013), Vintage Years were selected starting the year in which Preqin provides greater than or equal to 20 funds in a given vintage, and ending in 2013 to only include mature funds as defined by fund incepted 10 years or greater, Net Multiple (X) Median, Top Quartile Boundary (Q1), Bottom Quartile Boundary (Q3), as of Most-Up-to-Date, on 1/5/2023.
In real estate, while performance dispersion across vintages was relatively lower, the ultimate performance of peer groups was much more concentrated within specific ranges. For example, there were only two instances of 75th percentile funds generating a net multiple between 1.25-1.5x—the range at which the majority (13 out of 22) of 25th percentile funds ultimately performed. However, there was still an overlap in outcomes between median and 75th percentile funds across vintages.
As expected, the same conclusions above appear to hold true when analyzing the above chart as they relate to dispersion and overlap. Most notably, we see a relatively higher dispersion across vintages in venture capital, particularly among 75th percentile funds.
Manager selection and vintage diversification are both considerations in allocating to private markets, and both may contribute significantly to the long-term performance of a private market allocation. However, as we see in this analysis, different private market strategies have exhibited varying degrees of performance dispersion across vintages. In practice, an advisor may want to devote effort to vintage diversification for strategies with historically greater dispersion across time.
FAQs: Navigating Vintage Diversification in Private Markets
How Can Vintage Diversification Bolster Alternative Investments?
When it comes to alternative investments, diversifying across vintages can give advisors a potential hedge against the unpredictabilities of the business cycle and overall market conditions, limiting concentration to any specific exit environment, which can have significant impacts on the return of a fund. While there are no guarantees, advisors who circulate capital across different vintages can ensure they aren't overly concentrated in a single period.
Why Is Timing Crucial for Private Equity Managers in Venture Capital?
Venture capital usually involves startups and early-stage companies. That means it can be very risky. Keeping the likelihood of market volatility in mind, the timing of the first investment has a major impact on the performance of a particular fund. Similarly, private equity managers must be able to gauge both the conditions of the market and the valuation of potential portfolio companies to optimize returns.
How Might Commitment Pacing Programs Benefit Limited Partners (LPs)?
For LPs, commitment pacing programs can offer a more structured approach to allocating committed capital over time. This strategy, akin to dollar-cost-averaging in public markets, allows LPs to diversify across vintages, mitigating risks associated with market volatility and fluctuations in cash flows.
What Challenges Arise in Balancing Management Fees and Fund Performance?
In the private equity world, vintage years show when a fund began investing and are key to judging its success and viability. However, fund managers have to think about more than just vintage years; they have to balance the potential for outsized returns with moderation of costs, like management fees.
For instance, a strong vintage year fund might lose its shine if high fees don't match remarkable returns. On the other hand, a modestly performing fund from a tough vintage can still attract savvy advisors with fair fees.


