What you’ll learn
Among all other alternative asset classes featured in the CAIS-Mercer alternative investment survey, hedge funds were the most selected alternative asset class for diversification of risk with 51% of respondents selecting this feature as what they seek to achieve for allocating to the asset class.
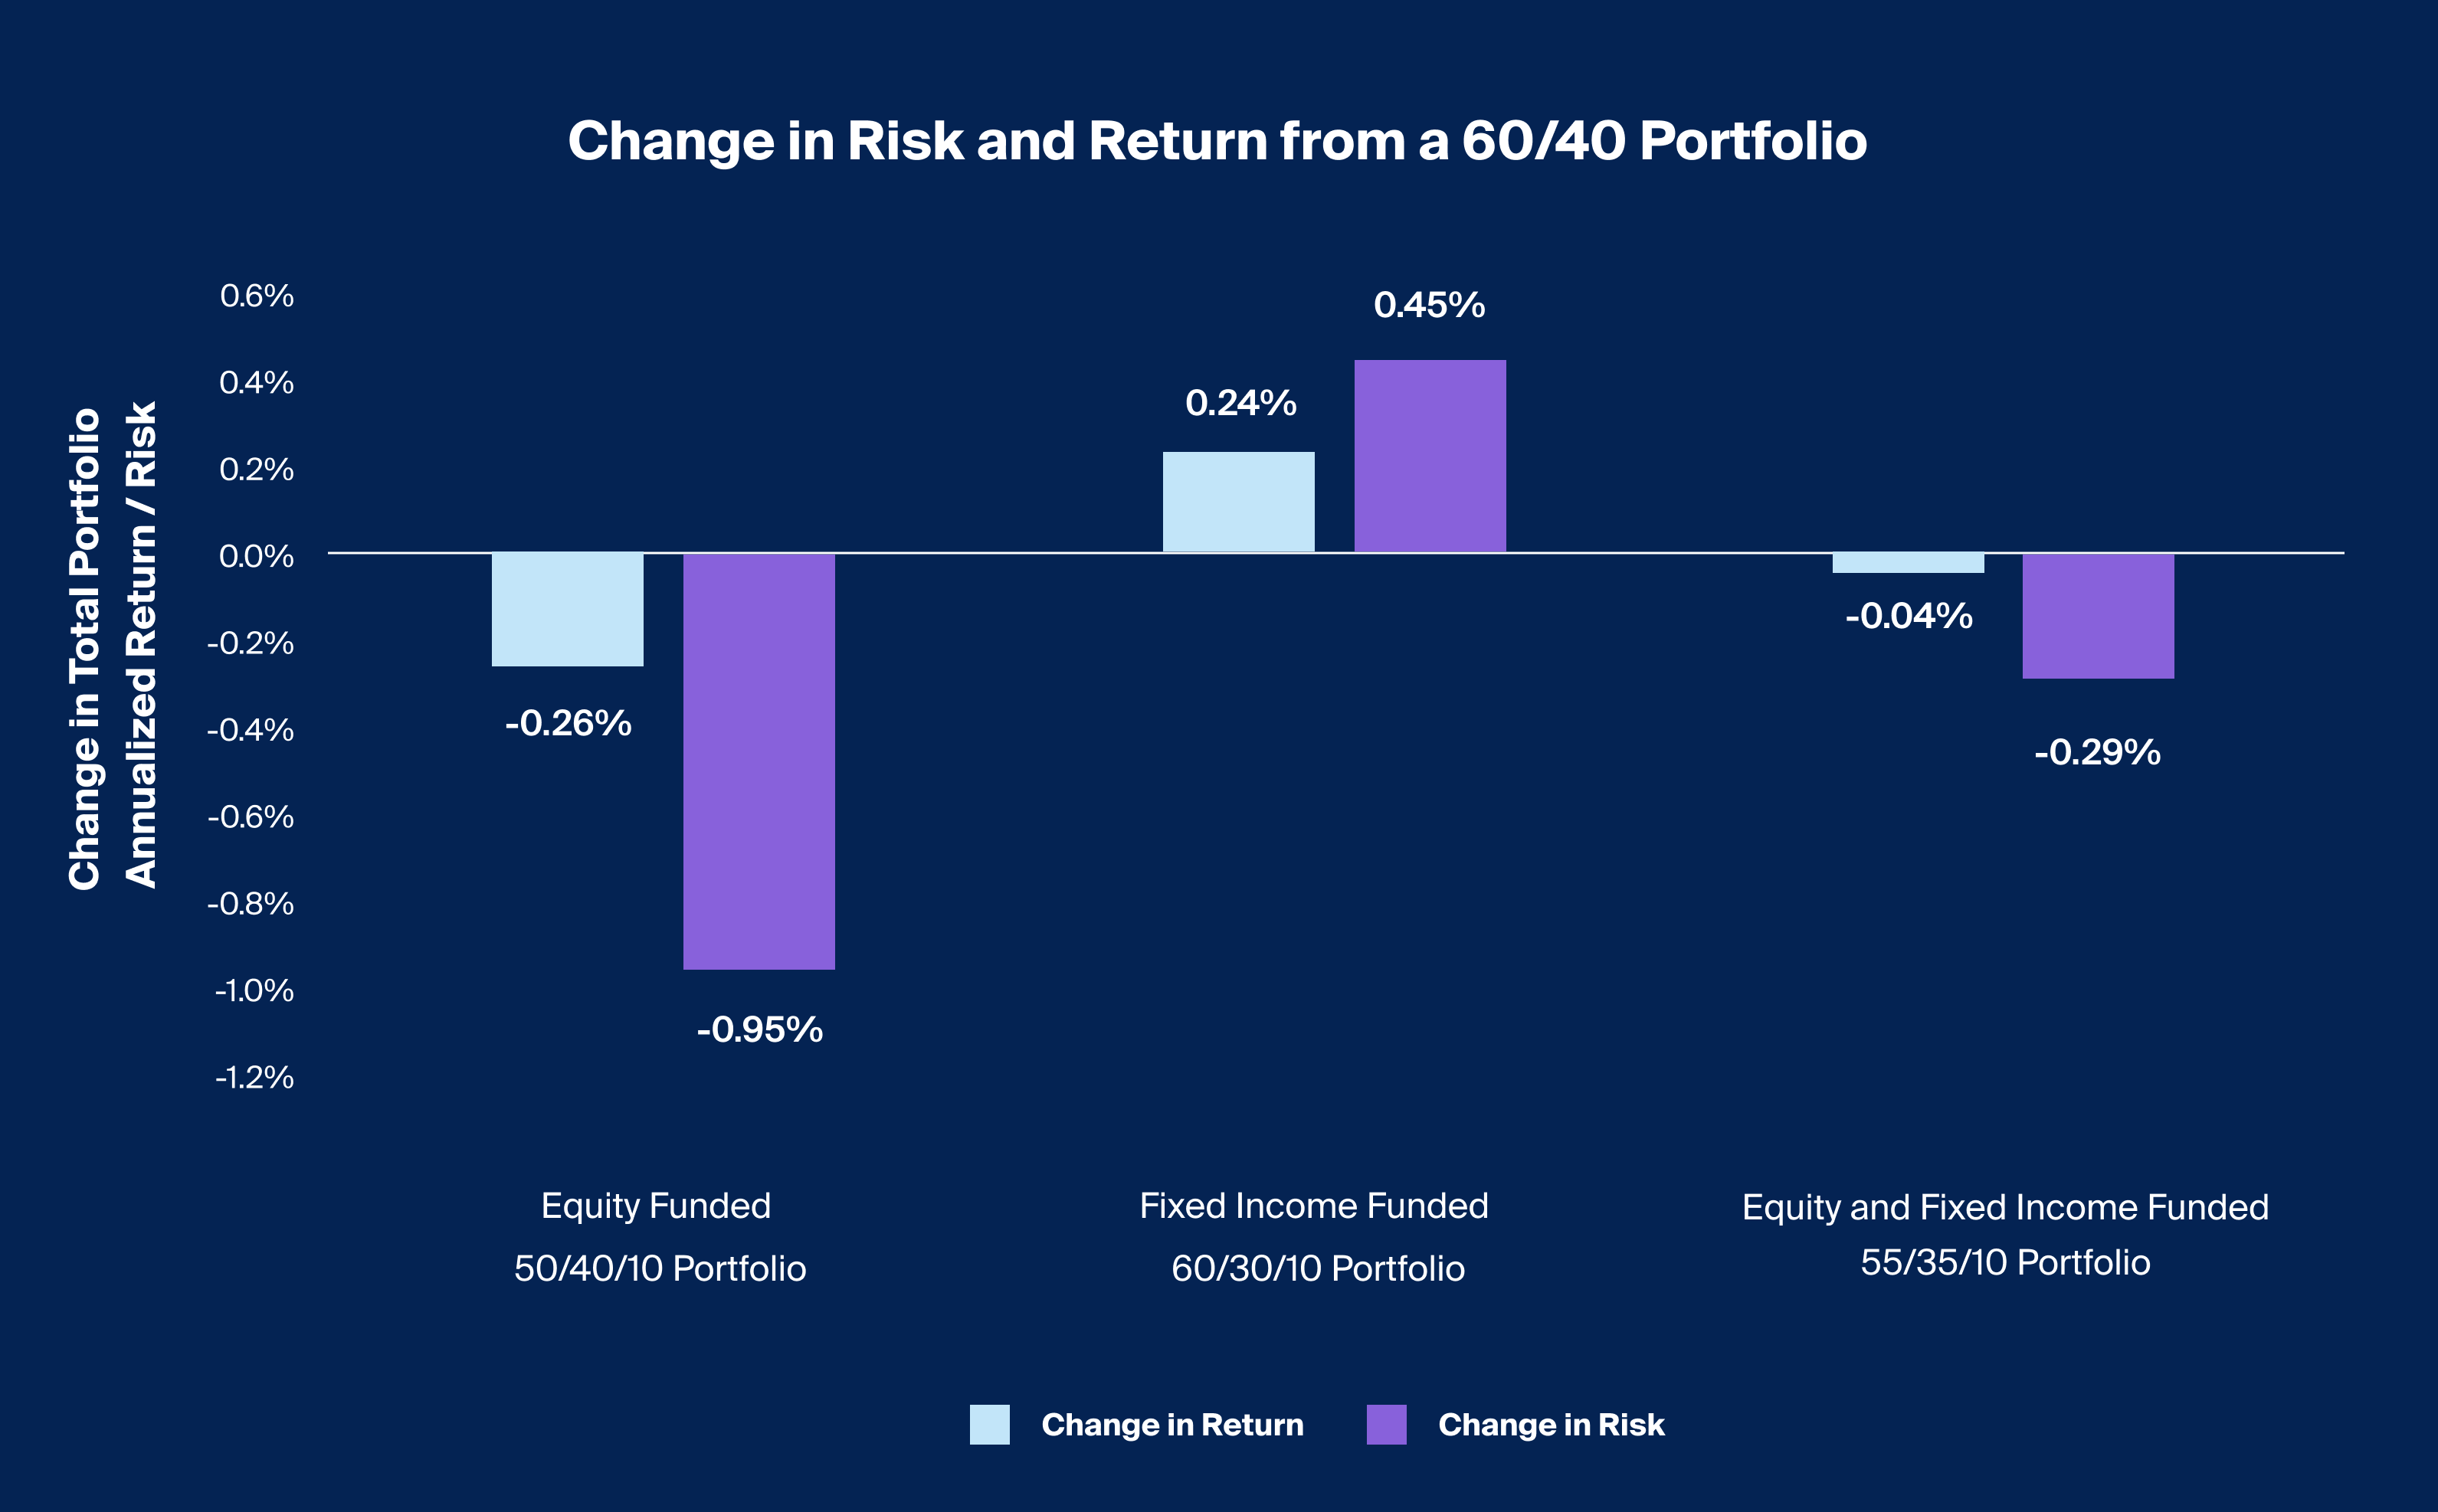
In a traditional 60/40 portfolio, and based on our historical analysis over the past 20 years, funding an allocation to hedge funds with equity may have minimized portfolio risk, represented by annualized standard deviation, but at the cost of return, represented by annualized return. Conversely, funding through fixed income appears to have increased return, but at the cost of an increase in risk.However, past performance is no guarantee of future results.
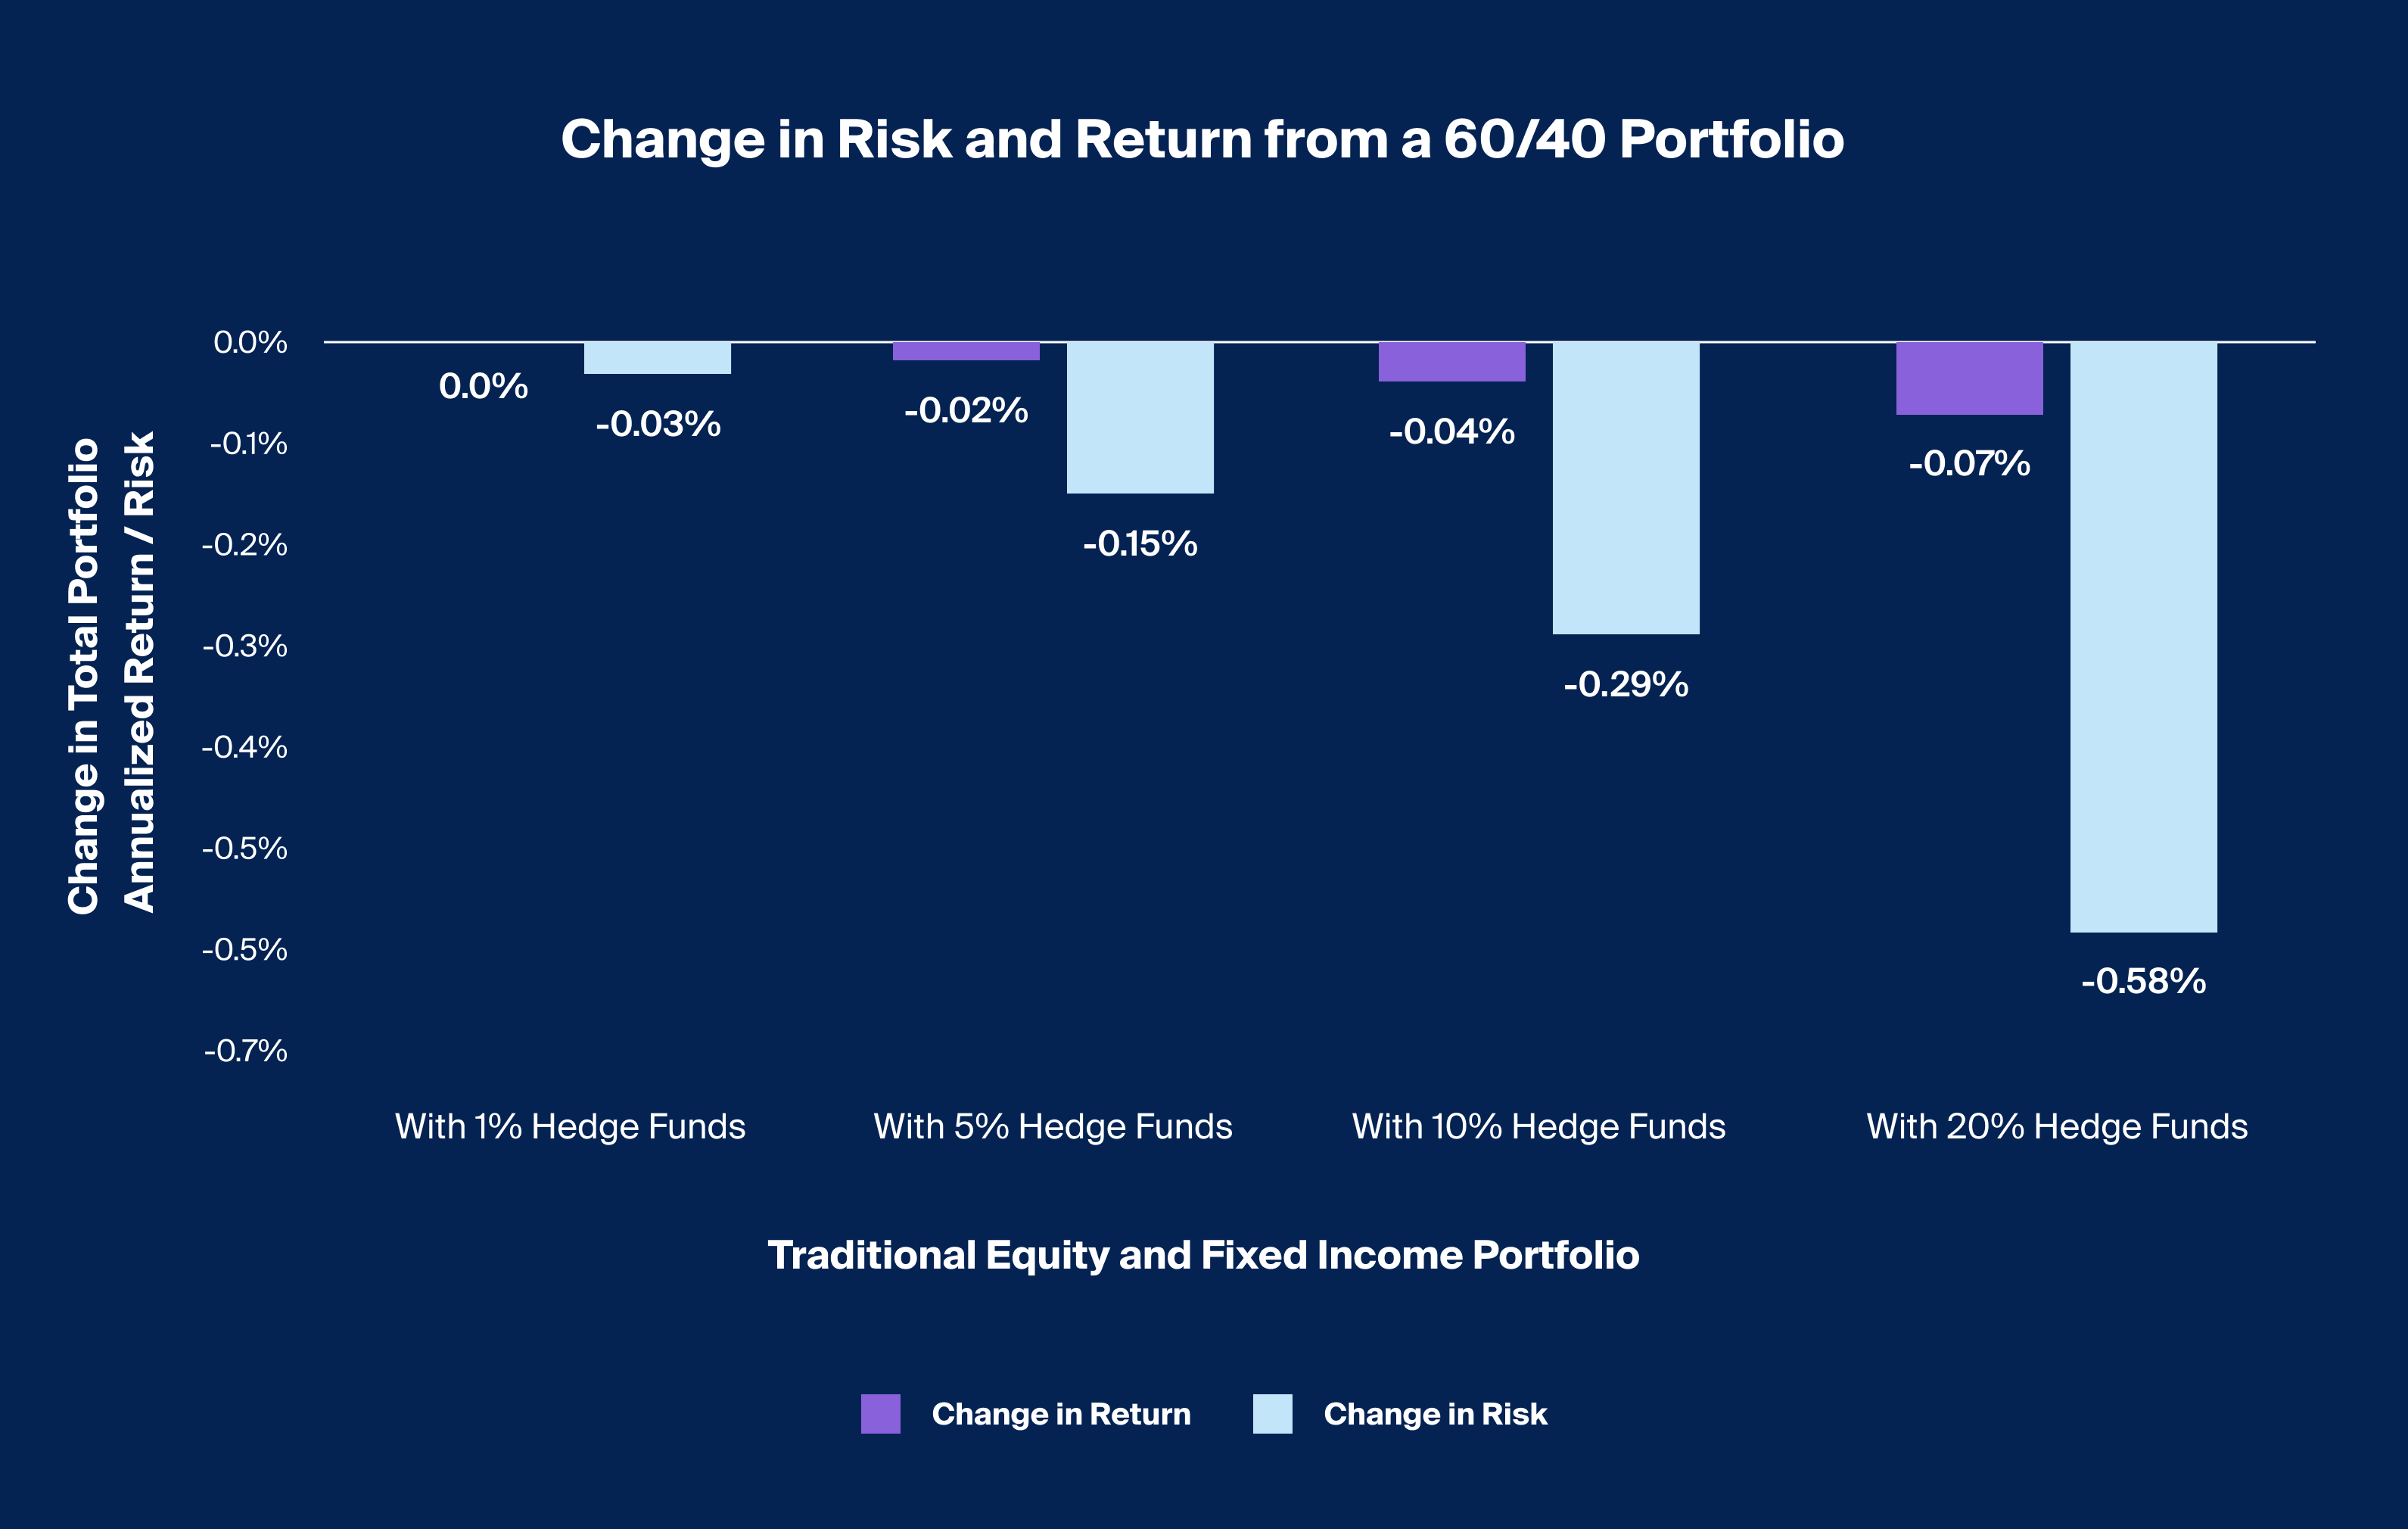
An allocation to hedge funds at numerous sizes from 1% to 20%, depicted a reduction of risk outpacing the decline in return.
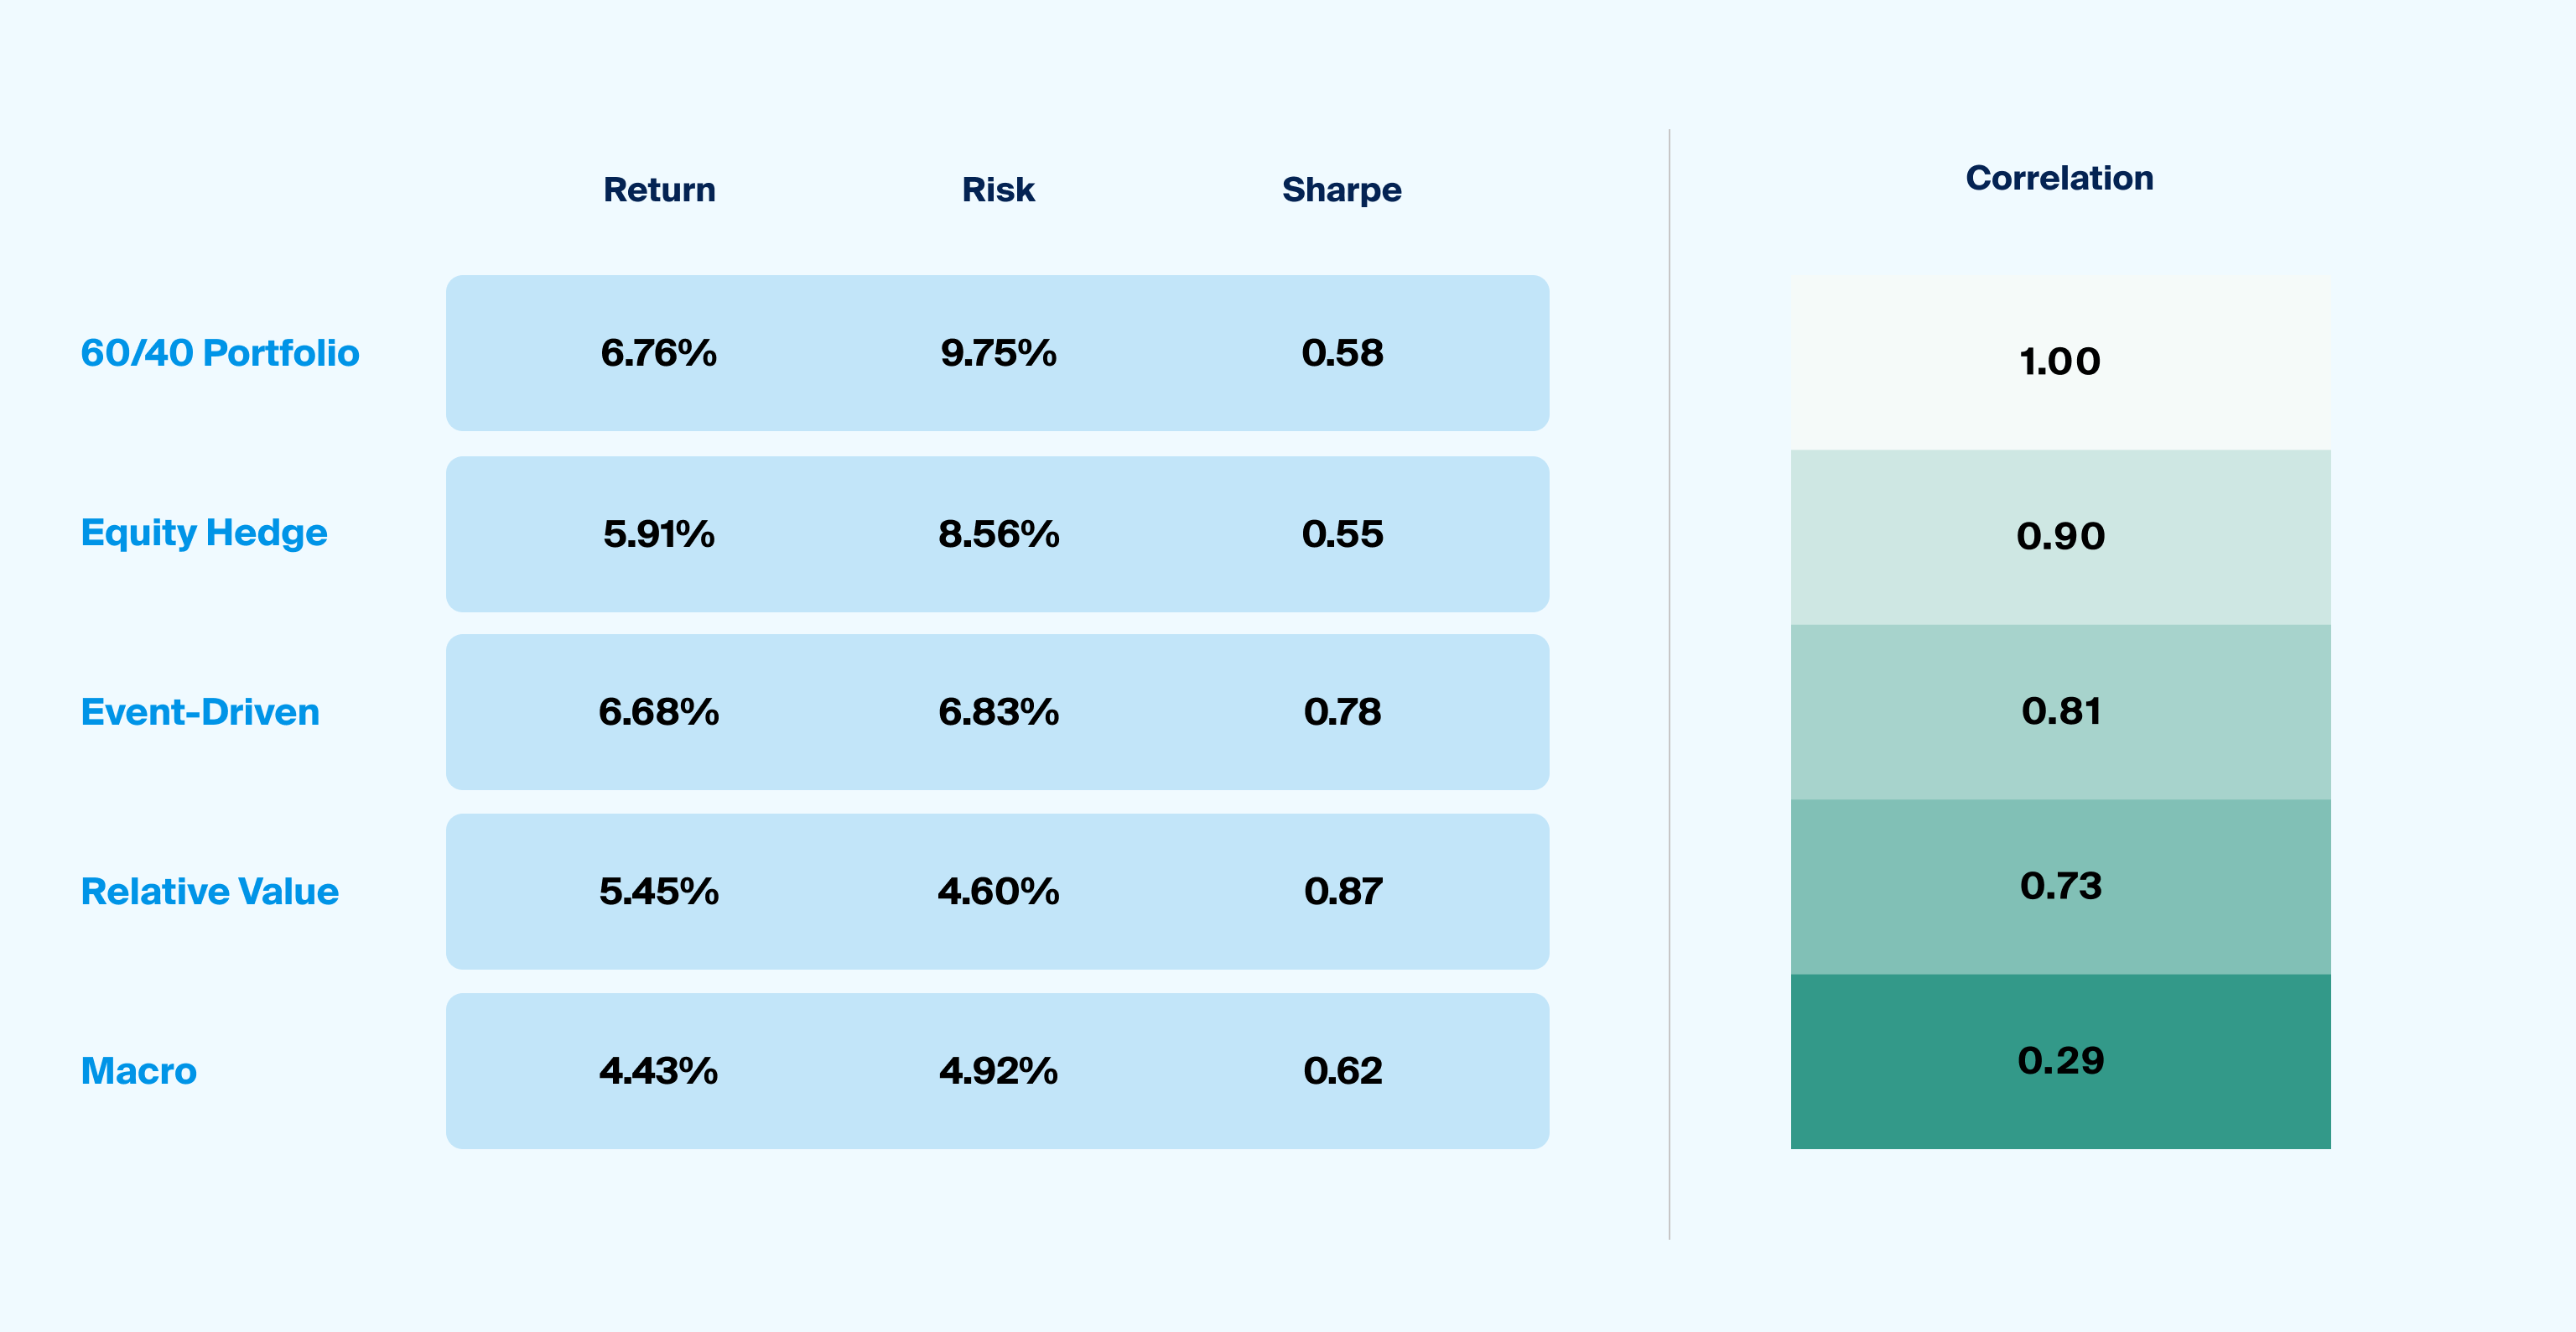
While Macro appeared to be the best diversifier in terms of a lower correlation, it did not increase the portfolios risk-adjusted return the same way that relative value did, and it did not enhance return the same way event-driven and equity hedge had in our analysis of historical data.
As some advisors are shifting towards increasing allocations to alternative investments1, interest in hedge funds in particular has re-emerged in the context of this new macroeconomic regime. But when it comes to implementation, what factors may advisors consider when seeking to incorporate this asset class in portfolios?
In our recent survey conducted in collaboration with Mercer, advisors were asked to assign an investment objective to each asset class. Among all other alternative asset classes, hedge funds were the most selected for diversification of risk with 51% of respondents selecting this feature as the primary objective in allocating to the asset class. Advisors also indicated they sought return enhancement (33%) and capital preservation (13%) from this diverse asset class.
Given the various objectives advisors seek when allocating to hedge funds, we seek to assess the total portfolio implications of the portfolio construction decisions related to allocating to this asset class. We start our assessment with the asset class’s correlation to the traditional 60/40, public equities, and public fixed income. We utilize the HFRI Hedge Fund Composite Index – while this index is not investable, it provides a relatively long-dated and representative return stream for our analysis. Our assessment considers the past 20 years of historical performance data, through December 2023.

Footnotes
Source: Bloomberg; Global Equity represented by the MSCI ACWI Net Total Return Index, Fixed Income represented by the Bloomberg Barclays US Aggregate Bond Index, 60/40 Portfolio represented by 60% allocation to Global Equity and 40% allocation to Fixed Income, HFR; Hedge Funds represented by the HFRI Hedge Fund Composite Index, Venn; for calculations, as of December 2023. Return is the annualized return and risk is the annualized standard deviation. Past performance is no guarantee of future results. This graphic does not predict or project performance or imply that past performance will recur.
The Hedge Fund Composite Index historically has achieved a lower correlation to fixed income than equity (Exhibit 1)
We first notice that fixed income has historically provided a reasonably low correlation to equity, a historically reliable feature of the traditional 60/40 portfolio that has recently been called into question(Exhibit 1). We note that the correlation between the hedge fund index and fixed income is lower than the correlation of the two components of the 60/40 portfolio. An allocation to hedge funds may increase the diversification potential of traditional portfolios as adding additional lower correlated assets may increase risk adjusted return.2
While the case for diversification seems apparent and measurable, return enhancement and capital preservation are objectives less clear using just a correlation matrix. So, what would adding hedge funds to a traditional portfolio look like in terms of risk and return? As we add hedge funds to portfolios, we consider some important factors of implementation. One factor is sourcing, which asks where this allocation would be funded from. In the case of hedge funds, we evaluate how performance of a 60/40 portfolio, without a cash allocation, is impacted when making an allocation sourced from equity, fixed income, or both equally.

Footnotes
Source: Bloomberg, HFR; 60/40 Portfolio represented by 60% allocation to the MSCI ACWI Net Total Return Index and 40% allocation to the Bloomberg Barclays US Aggregate Bond Index, 50/40/10 represented by 50% allocation to the MSCI ACWI Net Total Return Index, 40% allocation to the Bloomberg Barclays US Aggregate Bond Index, and 10% allocation to the HFRI Hedge Fund Composite Index, 60/30/10 represented by 60% allocation to the MSCI ACWI Net Total Return Index, 30% allocation to the Bloomberg Barclays US Aggregate Bond Index, and 10% HFRI Hedge Fund Composite Index, 55/35/10 represented by 55% allocation to the MSCI ACWI Net Total Return Index, 35% allocation to the Bloomberg Barclays US Aggregate Bond Index, and 10% allocation to the HFRI Hedge Fund Composite Index, Venn; for calculations, as of December 2023. Return is the annualized return and risk is the annualized standard deviation. Past performance is no guarantee of future results. This graphic does not predict or project performance or imply that past performance will recur.
Funding an allocation to hedge funds with equity, fixed income, or both, historically resulted in differing risk and return trade-offs (Exhibit 2)
During the period of review, our analysis appears to indicate that funding an allocation to hedge funds with equity would have substantially minimized portfolio risk, but at the cost of return. However, funding through fixed income appears to have resulted in an increased return, at the cost of an increase in risk, something that may be less desirable if capital preservation is a main objective. An equally funded allocation appeared to have simultaneously reduce risk while also reducing return (Exhibit 2). For advisors considering an allocation to hedge funds, the historical analysis appears to indicate that the funding question remains subject to the objectives of the portfolio. In other words, an allocation may require the balancing of trade-offs, where the chosen strategy corresponds to the objective that the hedge funds may serve in a portfolio. Of course, advisors should always remember that past performance is no guarantee of future results.
A second factor of implementation to consider is allocation size, which asks the question: how does risk and return change based on the size of the allocation?

Footnotes
Source: Bloomberg; 60/40 Portfolio represented by 60% allocation to the MSCI ACWI Net Total Return Index and 40% allocation to the Bloomberg Barclays US Aggregate Bond Index, HFR; each allocation to Hedge Funds represented by the HFRI Hedge Fund Composite Index, funded equally between Equity and Fixed Income, Venn; for calculations, as of December 2023. Return is the annualized return and risk is the annualized standard deviation. Past performance is no guarantee of future results. This graphic does not predict or project performance or imply that past performance will recur.
Incrementally larger allocations to hedge funds historically had a larger relative reduction to total portfolio risk compared to the loss in total return (Exhibit 3)
For this assessment, we depicted varying sizes of hedge fund allocations equally sourced between equity and fixed income to assess the marginal impact of allocation size on the historical risk and return of a portfolio. From allocation sizes 1% to 20%, we can observe that the reduction of return is far outpaced by the decline in risk (Exhibit 3). Based on the historical data in this analysis, an allocation to hedge funds between 1% and 20% would have reduced risk at the cost of some return.
While the purpose of an allocation itself may be subject to its stated objectives. the historical analysis appears to indicate that larger allocations to hedge funds preserved capital, as portfolio risk was reduced, with, however, a marginal impact to return.
We’ve shown that historically, when added to a traditional portfolio, aggregate hedge fund performance appeared to decrease and diversify risk. The hedge fund strategies one may allocate to generally fall into one of the four categorizations, Equity Hedge, Event-Driven, Relative Value and Macro. listed below (Exhibit 4). Each of these strategies may be equipped to perform differently across market environments, as each strategy aims to capitalize in different ways.

Footnotes
Source: Bloomberg; 60/40 Portfolio represented by 60% allocation to the MSCI ACWI Net Total Return Index and 40% allocation to the Bloomberg Barclays US Aggregate Bond Index, HFR; Equity Hedge represented by the HFRI Equity Hedge (Total) Index, Event-Driven represented by the HFRI Event-Driven (Total) Index, Relative Value represented by the HFRI Relative Value (Total) Index, Macro represented by the HFRI Macro (Total) Index, Venn; for calculations, as of December 2023. Return is the annualized return and risk is the annualized standard deviation. Past performance is no guarantee of future results. This graphic does not predict or project performance or imply that past performance will recur.
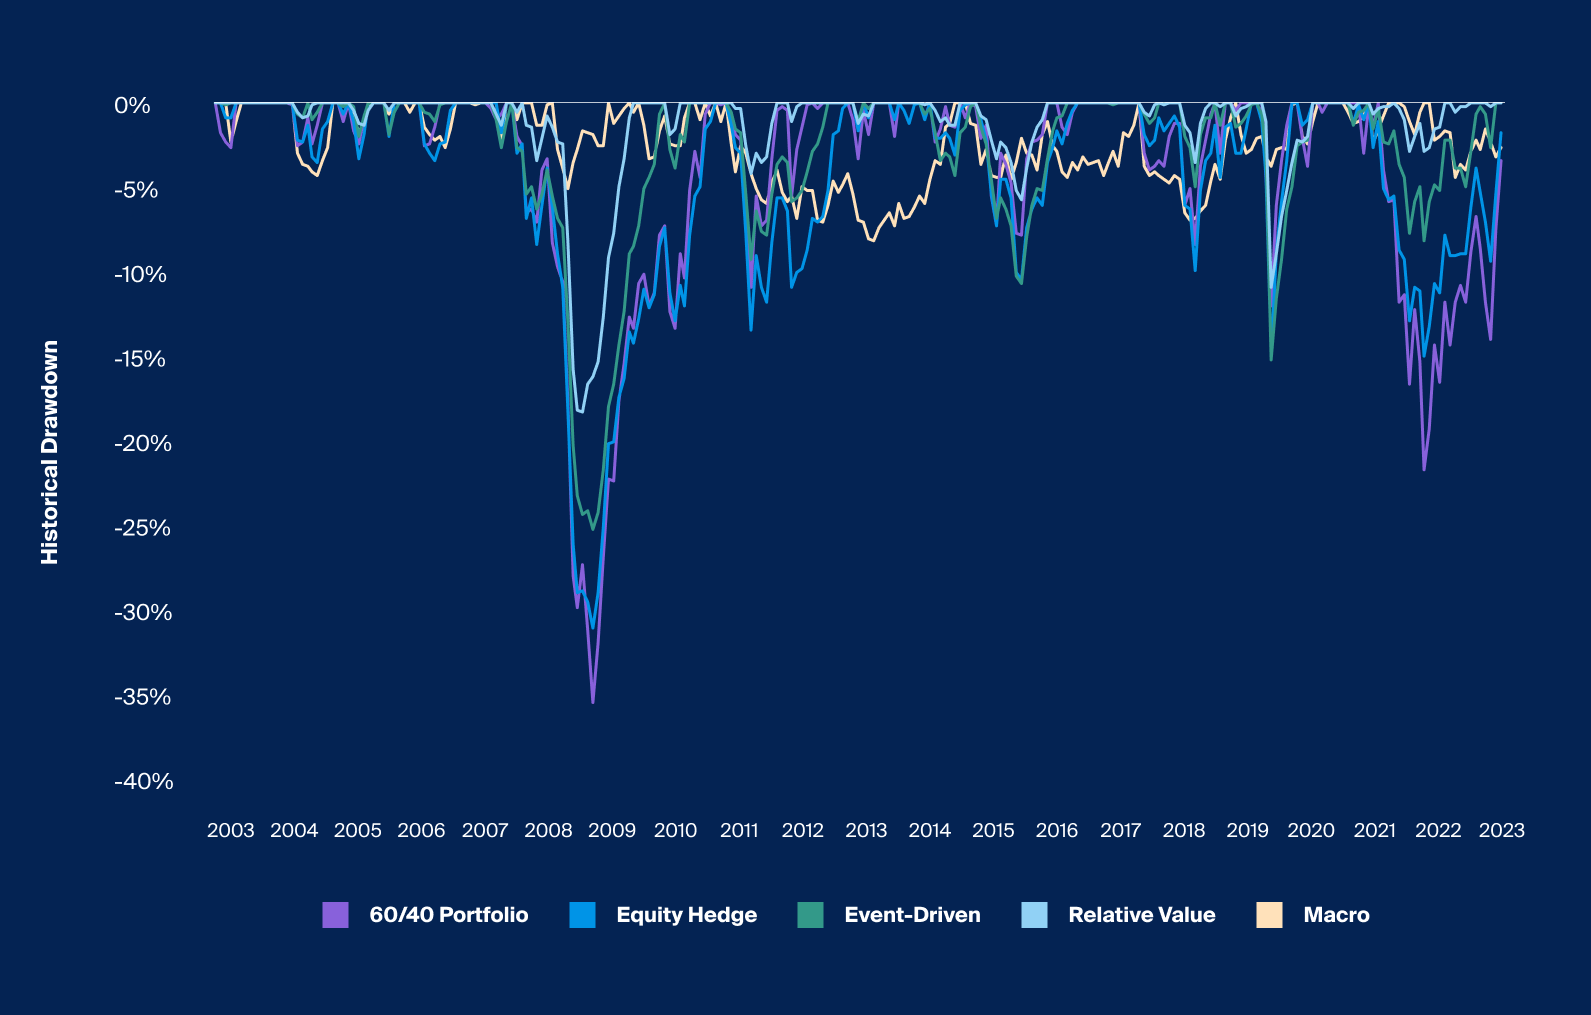
Hedge fund strategies have historically exhibited different magnitudes and timing of drawdowns across different market environments (Exhibit 4)
Through the lens of historical drawdown, a well-traveled measure of assessing the downside protection and risk mitigation of investments, we can analyze the variation of performance across strategies in practice. Some strategies, such as Macro would have historically been more equipped to preserve capital while others like Event-Driven and Equity Hedge appear to have followed more closely the fluctuations of traditional indices and the 60/40 portfolio which contain them.

Footnotes
Source: Bloomberg; 60/40 Portfolio represented by 60% allocation to the MSCI ACWI Net Total Return Index and 40% allocation to the Bloomberg Barclays US Aggregate Bond Index, HFR; Equity Hedge represented by the HFRI Equity Hedge (Total) Index, Event-Driven represented by the HFRI Event-Driven (Total) Index, Relative Value represented by the HFRI Relative Value (Total) Index, Macro represented by the HFRI Macro (Total) Index, Venn; for calculations, as of December 2023. Return is the annualized return and risk is the annualized standard deviation. Past performance is no guarantee of future results. This graphic does not predict or project performance or imply that past performance will recur.
Hedge fund strategies can vary significantly in their ability to achieve different portfolio objectives (Exhibit 5)
Each of these hedge fund strategies can vary in their ability to diversify risk and generate risk-adjusted return. The Sharpe ratio and the correlation to the traditional 60/40 portfolio of each of these strategies vary just as much as their return and risk, which suggests the importance of measuring tradeoffs and understanding what objectives are targeted with hedge funds all the way down to the strategy level.
While Macro appears to have been historically the best diversifier in terms of a lower correlation, historical data indicates that it may not have increased a portfolios risk adjusted return the same way that Relative Value might have, or it may not have enhanced return the same way Event-Driven and Equity Hedge have in the past (Exhibit 5).
That said, our this analysis was is conducted using the historical return of indices that are not directly investible, solely for the purpose of assessing the impact of different implementation techniques of allocation to alternative asset classes. We do not aim to suggest or project the future performance of these indices or to imply that past performance will recur.
From choosing the desired strategy for a portfolio, to sourcing and sizing an allocation, advisor may wish to consider what they are looking to achieve in a portfolio and where to align their objectives.


