The Fed continues navigating what appears to be an ever-finer line between a hard and soft landing for the U.S. economy. We look past the most recent GDP estimate to leading economic indicators that have historically proven to have greater predictive power to signal turning points in the economy1 in an attempt to better understand the probability of an impending recession.
As recession risks appear to rise, investors may find opportunities in alternative investments to attempt to increase the protection of their portfolios and seek to take advantage of potentially worsening economic conditions.
Strategies designed to enable capital preservation, like protection-focused notes, and those that can provide portfolio diversification, like hedge funds, may be particularly impactful in recessionary periods. In addition, special situations and distressed debt strategies may enable investors to access opportunities that typically arise as companies navigate a challenging environment of higher interest rates and increasing economic uncertainty.
Leading Indicators with Predictive Power2
GDP has been estimated to have fallen for the second consecutive quarter into 2022. Meanwhile, the Fed3 and the White House4 have emphasized that they do not believe the U.S. is currently in a recession and rebuffed the view that a recession is officially inaugurated through two consecutive contractions of GDP.
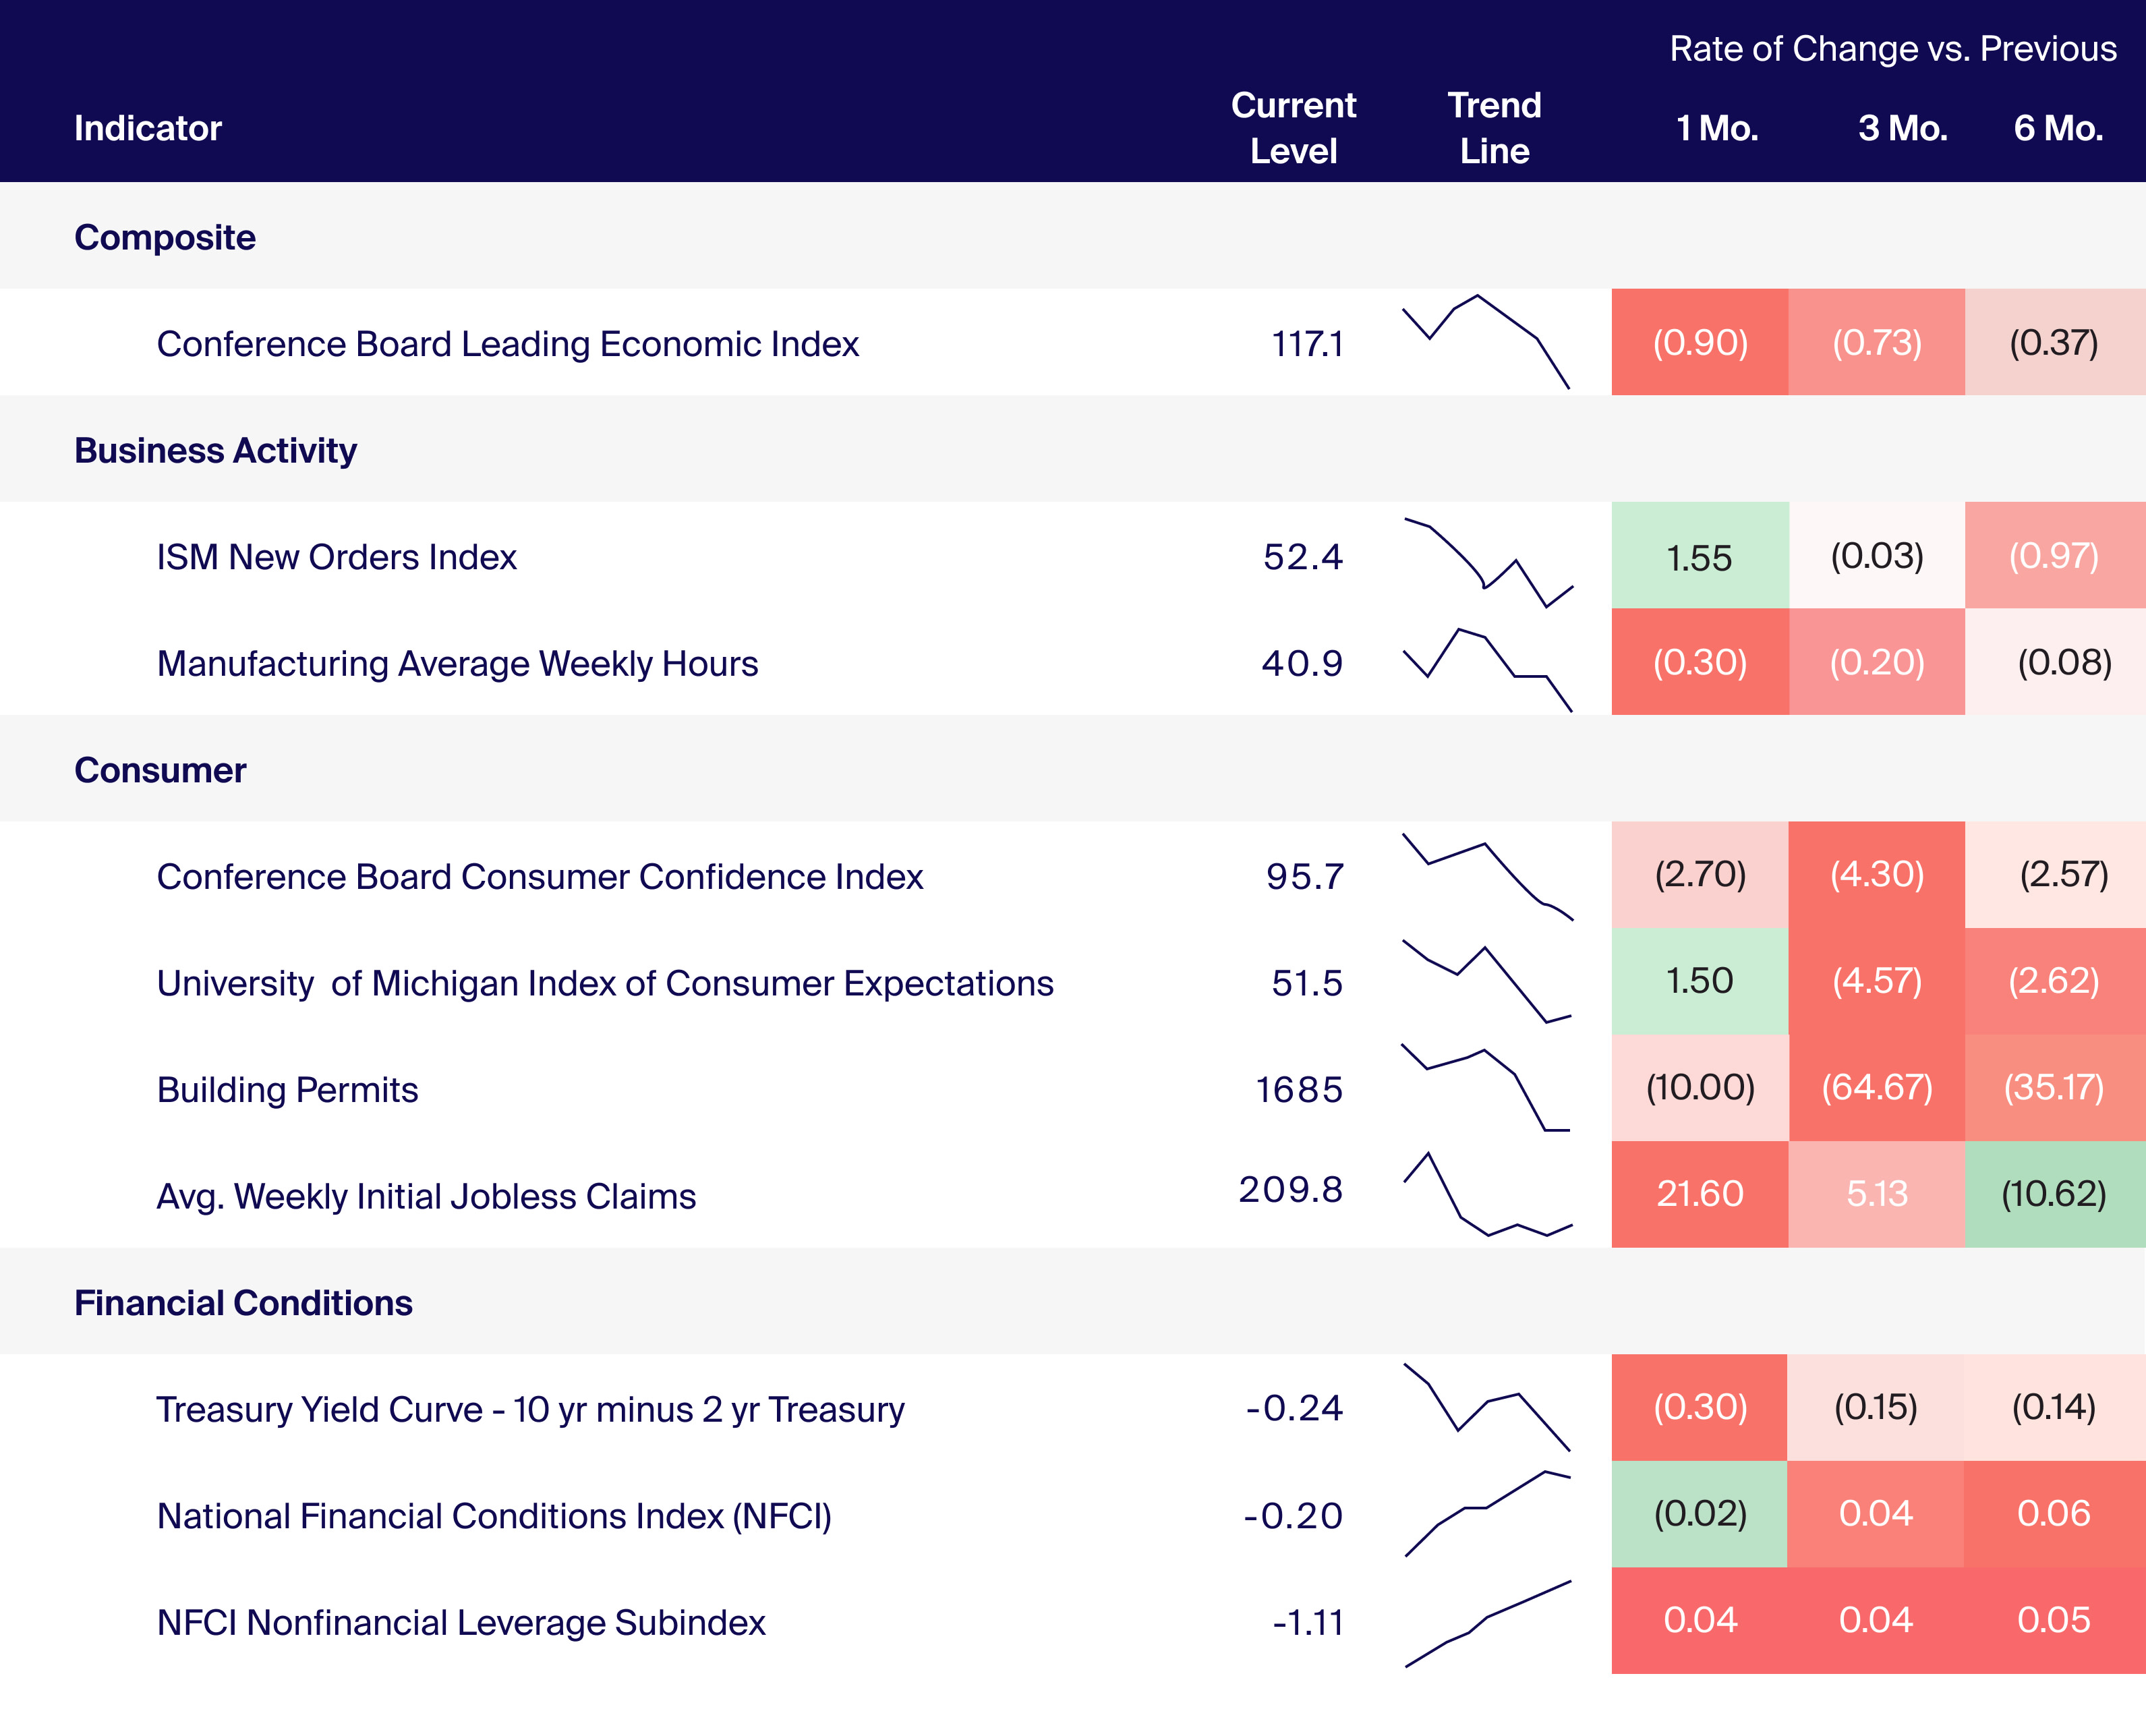
While the topic of GDP’s contribution to the definition of recession has been a hotly debated topic, it is important to remember that GDP growth is a lagging indicator of the state of the economy.5 To analyze the risk and potential severity of a recession, we look beyond GDP and through the slew of economic data to focus on indicators which tend to change in advance of the rest of the economy—specifically those statistically compelling in signaling past U.S. recessions (Exhibit 1).6

Source: Conference Board Leading Economic Index represented by the LEI TOTL Index, ISM New Orders Index represented by the COMHISMN Index, Manufacturing Average Weekly Hours represented by the LEI AVGW Index, Conference Board Consumer Confidence Index represented by the CONCCONF Index, University of Michigan Index of Consumer Expectations represented by the CONSSENT Index, Building Permits represented by the LEI BP Index, Avg. Weekly Initial Jobless Claims represented by the LEI WKIJ Index, Treasury Yield Curve - 10 yr minus 2 yr Treasury represented by the USGG10YR INDEX minus the USGG2YR INDEX National Financial Conditions Index (NFCI) represented by the NFCIINDX Index, NFCI nonfinancial leverage subindex represented by the NFCINFLG Index, as of 7/31/22.
To analyze the risk and potential severity of a recession, we look beyond GDP and through the slew of economic data to focus on indicators which tend to change in advance of the rest of the economy—specifically those statistically compelling in signaling past U.S. recessions.
The Conference Board Leading Economic Index, a composite of ten components spanning labor, real estate, the stock market, interest rate spread and consumer sentiment, anticipates turning points in the business cycle by around seven months7 and has historically dropped ahead of recessions and risen before expansions.8 While still near its all-time high, June saw the fourth consecutive month-on-month decrease in the index—the indicator’s last such occurrence were the months preceding the Global Financial Crisis—suggesting a meaningful trend in increasing likelihood of weaker economic activity in the near term.
To better assess the direction and trajectory of economic activity, we take a deeper look into the health of U.S. businesses and consumers.
Changes in Business Activity May Indicate a Turning Point
The equity market rebound in July, which some have labeled a bear market rally,9 may be partly attributed to a relatively positive earnings season thus far, alleviating some market participant’s concerns of an immediate downturn in the business cycle. Historically high profit margins have largely held as businesses broadly have been able to pass on rising costs to consumers, and earnings growth has been projected to grow—albeit at its lowest rate since Q4 2020.10
However, financial services firms and technology companies have begun announcing hiring freezes and layoffs, as CEOs begin planning for more economic uncertainty.11 Predictive leading indicators for business activity point in the same direction and reflect growing corporate pessimism, as the ISM New Orders Index and Manufacturing Average Weekly Hours have begun accelerating downward (Exhibit 1).

Source: Bloomberg, S&P 500 EPS represented by the SPEDACTL index, ISM Manufacturing PMI represented by the NAPMPMI Index, as of 7/31/2022.
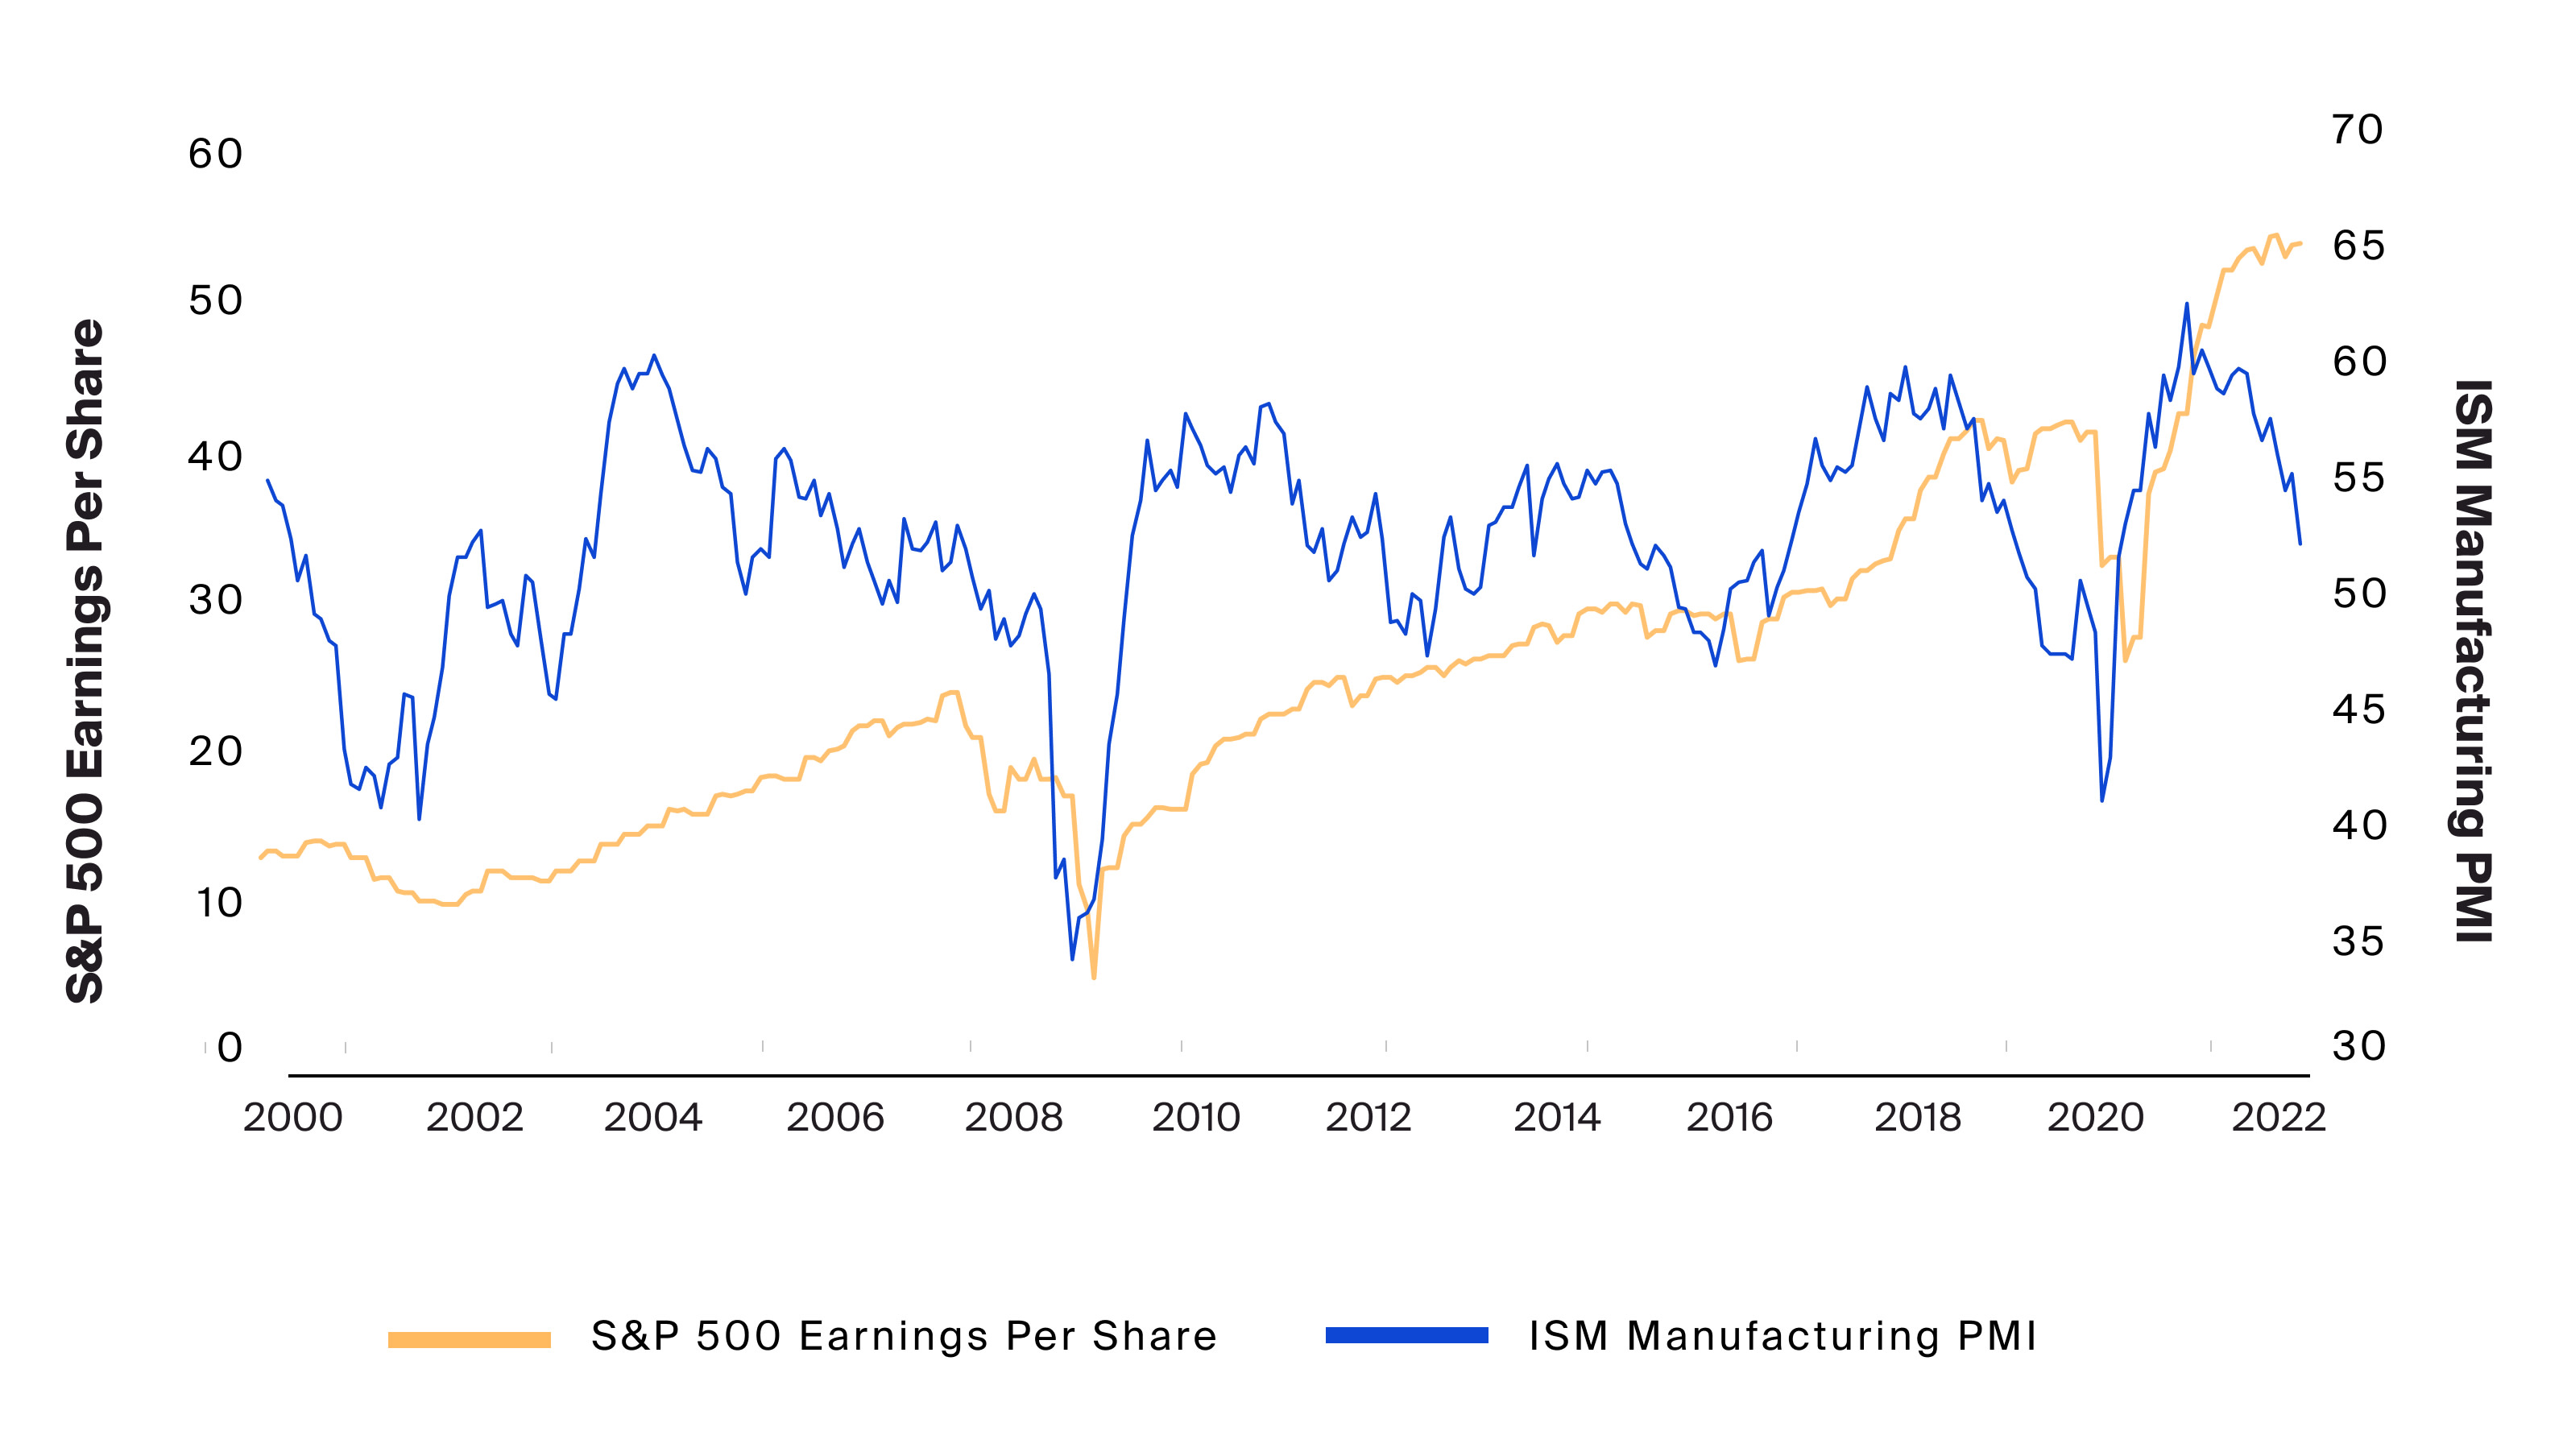
The ISM Manufacturing Purchasing Managers Index (ISM Manufacturing PMI), which surveys purchasing managers for manufacturers who are especially attuned to the ebbs and flows of the business cycle, has historically been a strong forward-looking indicator for earnings. While the ISM PMI’s most recent reading of 52.8 is above the critical expansion versus contraction threshold of 50.0, if sentiment continues in its current downward trajectory, earnings may follow in the coming months. This might suggest that we have yet to reach a bottom for equities.
The ISM Manufacturing Purchasing Managers Index (ISM Manufacturing PMI), which surveys purchasing managers for manufacturers who are especially attuned to the ebbs and flows of the business cycle, has historically been a strong forward-looking indicator for earnings (Exhibit 2). While the ISM PMI’s most recent reading of 52.8 is above the critical expansion versus contraction threshold of 50.0, if sentiment continues in its current downward trajectory, earnings may follow in the coming months. This might suggest that we have yet to reach a bottom for equities.
Cracks in the Consumer Firewall
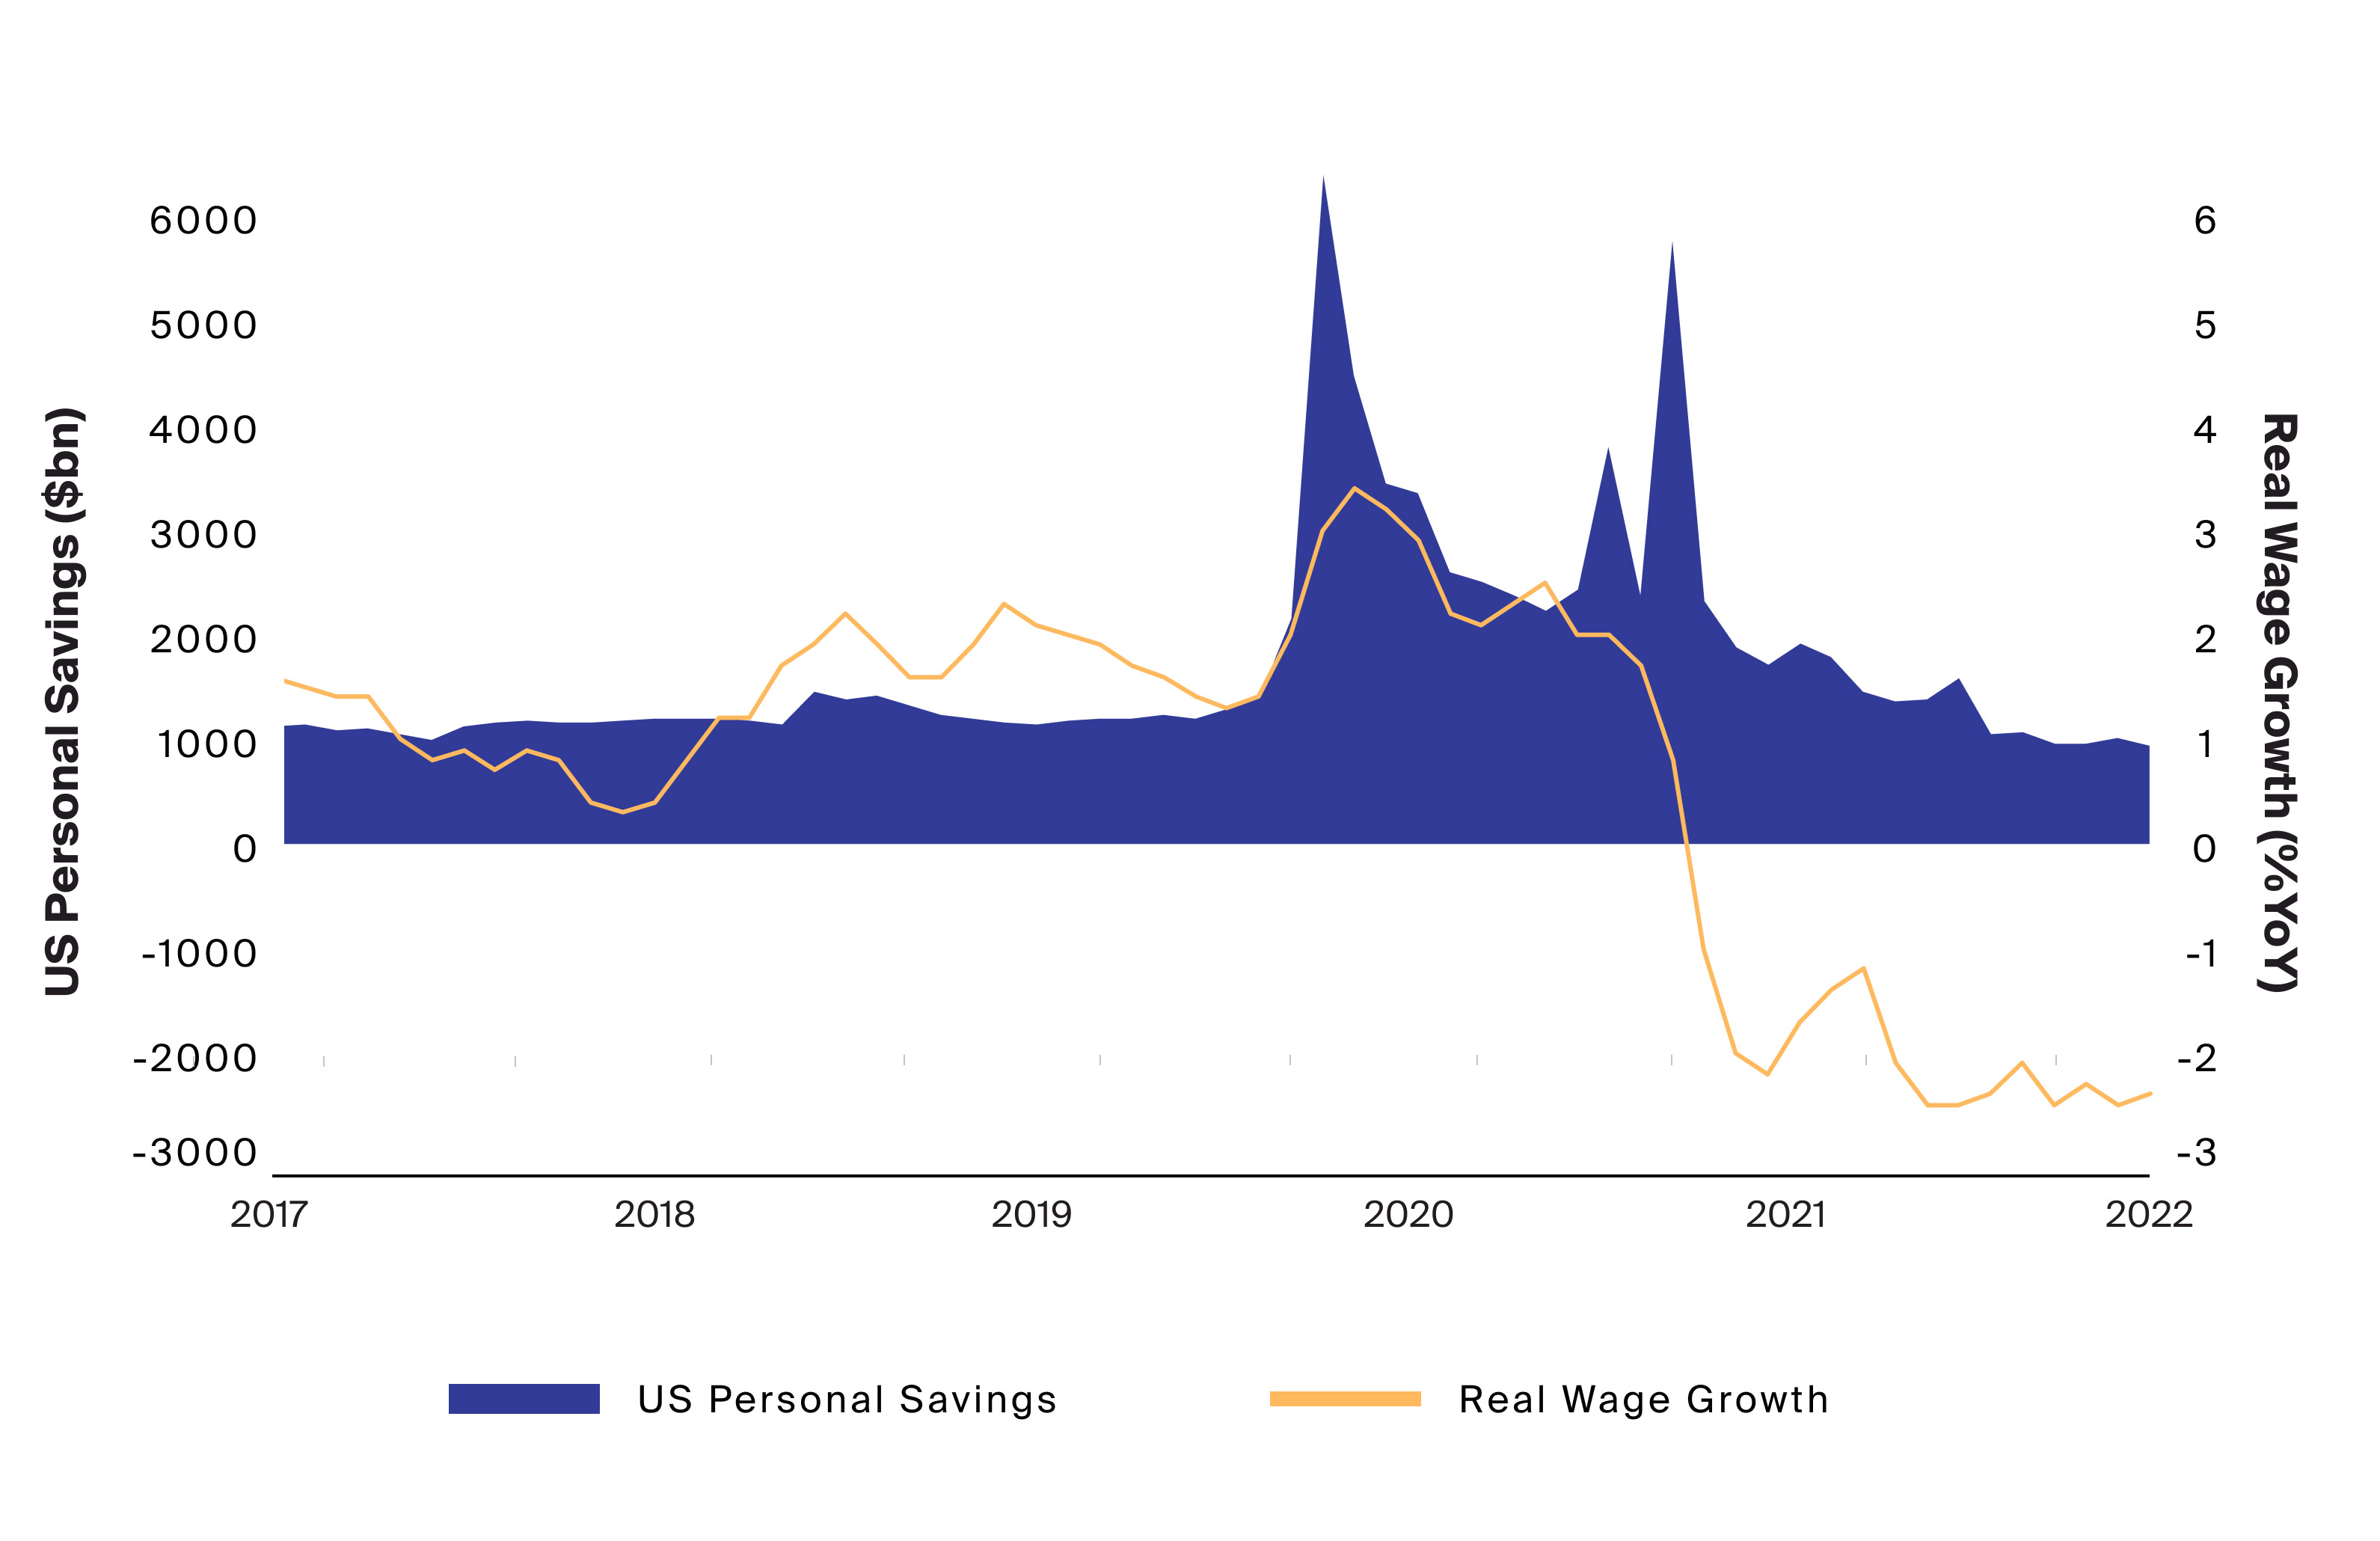
Over the course of the Covid-19 pandemic, U.S. consumers accumulated record savings12 through a combination of unprecedented fiscal stimulus and forced reduction in consumption, due to widespread lockdowns. These savings and the return of the U.S. consumer to pre-pandemic spending levels have provided a potential firewall against recession.13
However, consumer confidence has been plummeting and those savings are gradually deteriorating (Exhibit 3), which we may attribute to inflation outpacing nominal wage growth (negative real wage growth). Despite a multi-decade high in nominal wage growth14 due to the post-pandemic labor shortage—discussed in our previous article—negative real wage growth continues to deplete workers’ spending power, requiring consumers to tap into savings (Exhibit 3).

Source: Bloomberg, US Personal Savings represented by the PIDSS Index, Real Wage Growth represented by the calculated difference of WGTROVER Index and CPI YOY Index, as of 6/30/2022.
Consumer confidence has been plummeting and those savings are gradually deteriorating, which we may attribute to inflation outpacing nominal wage growth (negative real wage growth). Despite a multi-decade high in nominal wage growth due to the post-pandemic labor shortage—discussed in our previous article—negative real wage growth continues to deplete workers’ spending power, requiring consumers to tap into savings.
While demand for labor still broadly outstrips supply and the unemployment rate continues to hold near a 50-year low,15 initial jobless claims are on the rise (Exhibit 1) and job openings are beginning to shrink.16 If these trends continue and high inflation persists, real disposable income could continue to fall. Over time, this could chip away at consumers’ savings buffer, which may lead consumers to either increase borrowing or significantly cut back on spending.
Credit card balances have already begun to rise. In Q2, balances rose by $46 billion, a 13% increase quarter over quarter, which represents the largest increase in 20 years.17 A slowdown in consumption may be ameliorated by consumers increasing borrowing. However, at higher and rising interest rates, rising consumer debt may put additional pressure on the savings buffer. A sudden slowdown in consumption would have an outsized impact on the U.S. economy as consumption of goods and services account for nearly 70% of U.S. GDP18 - which may increase the probability of a hard landing.
Headline inflation is however expected to moderate in the coming months as volatile energy and food prices have fallen. How fast inflation falls and at what level it settles may ultimately determine the direction of real wage growth and the resilience of consumers.
Preparing Portfolios for Potentially Growing Recession Risks
In periods of uncertainty, investors have an opportunity to reevaluate their asset allocation and take steps toward building a more resilient portfolio.
Hedge Funds
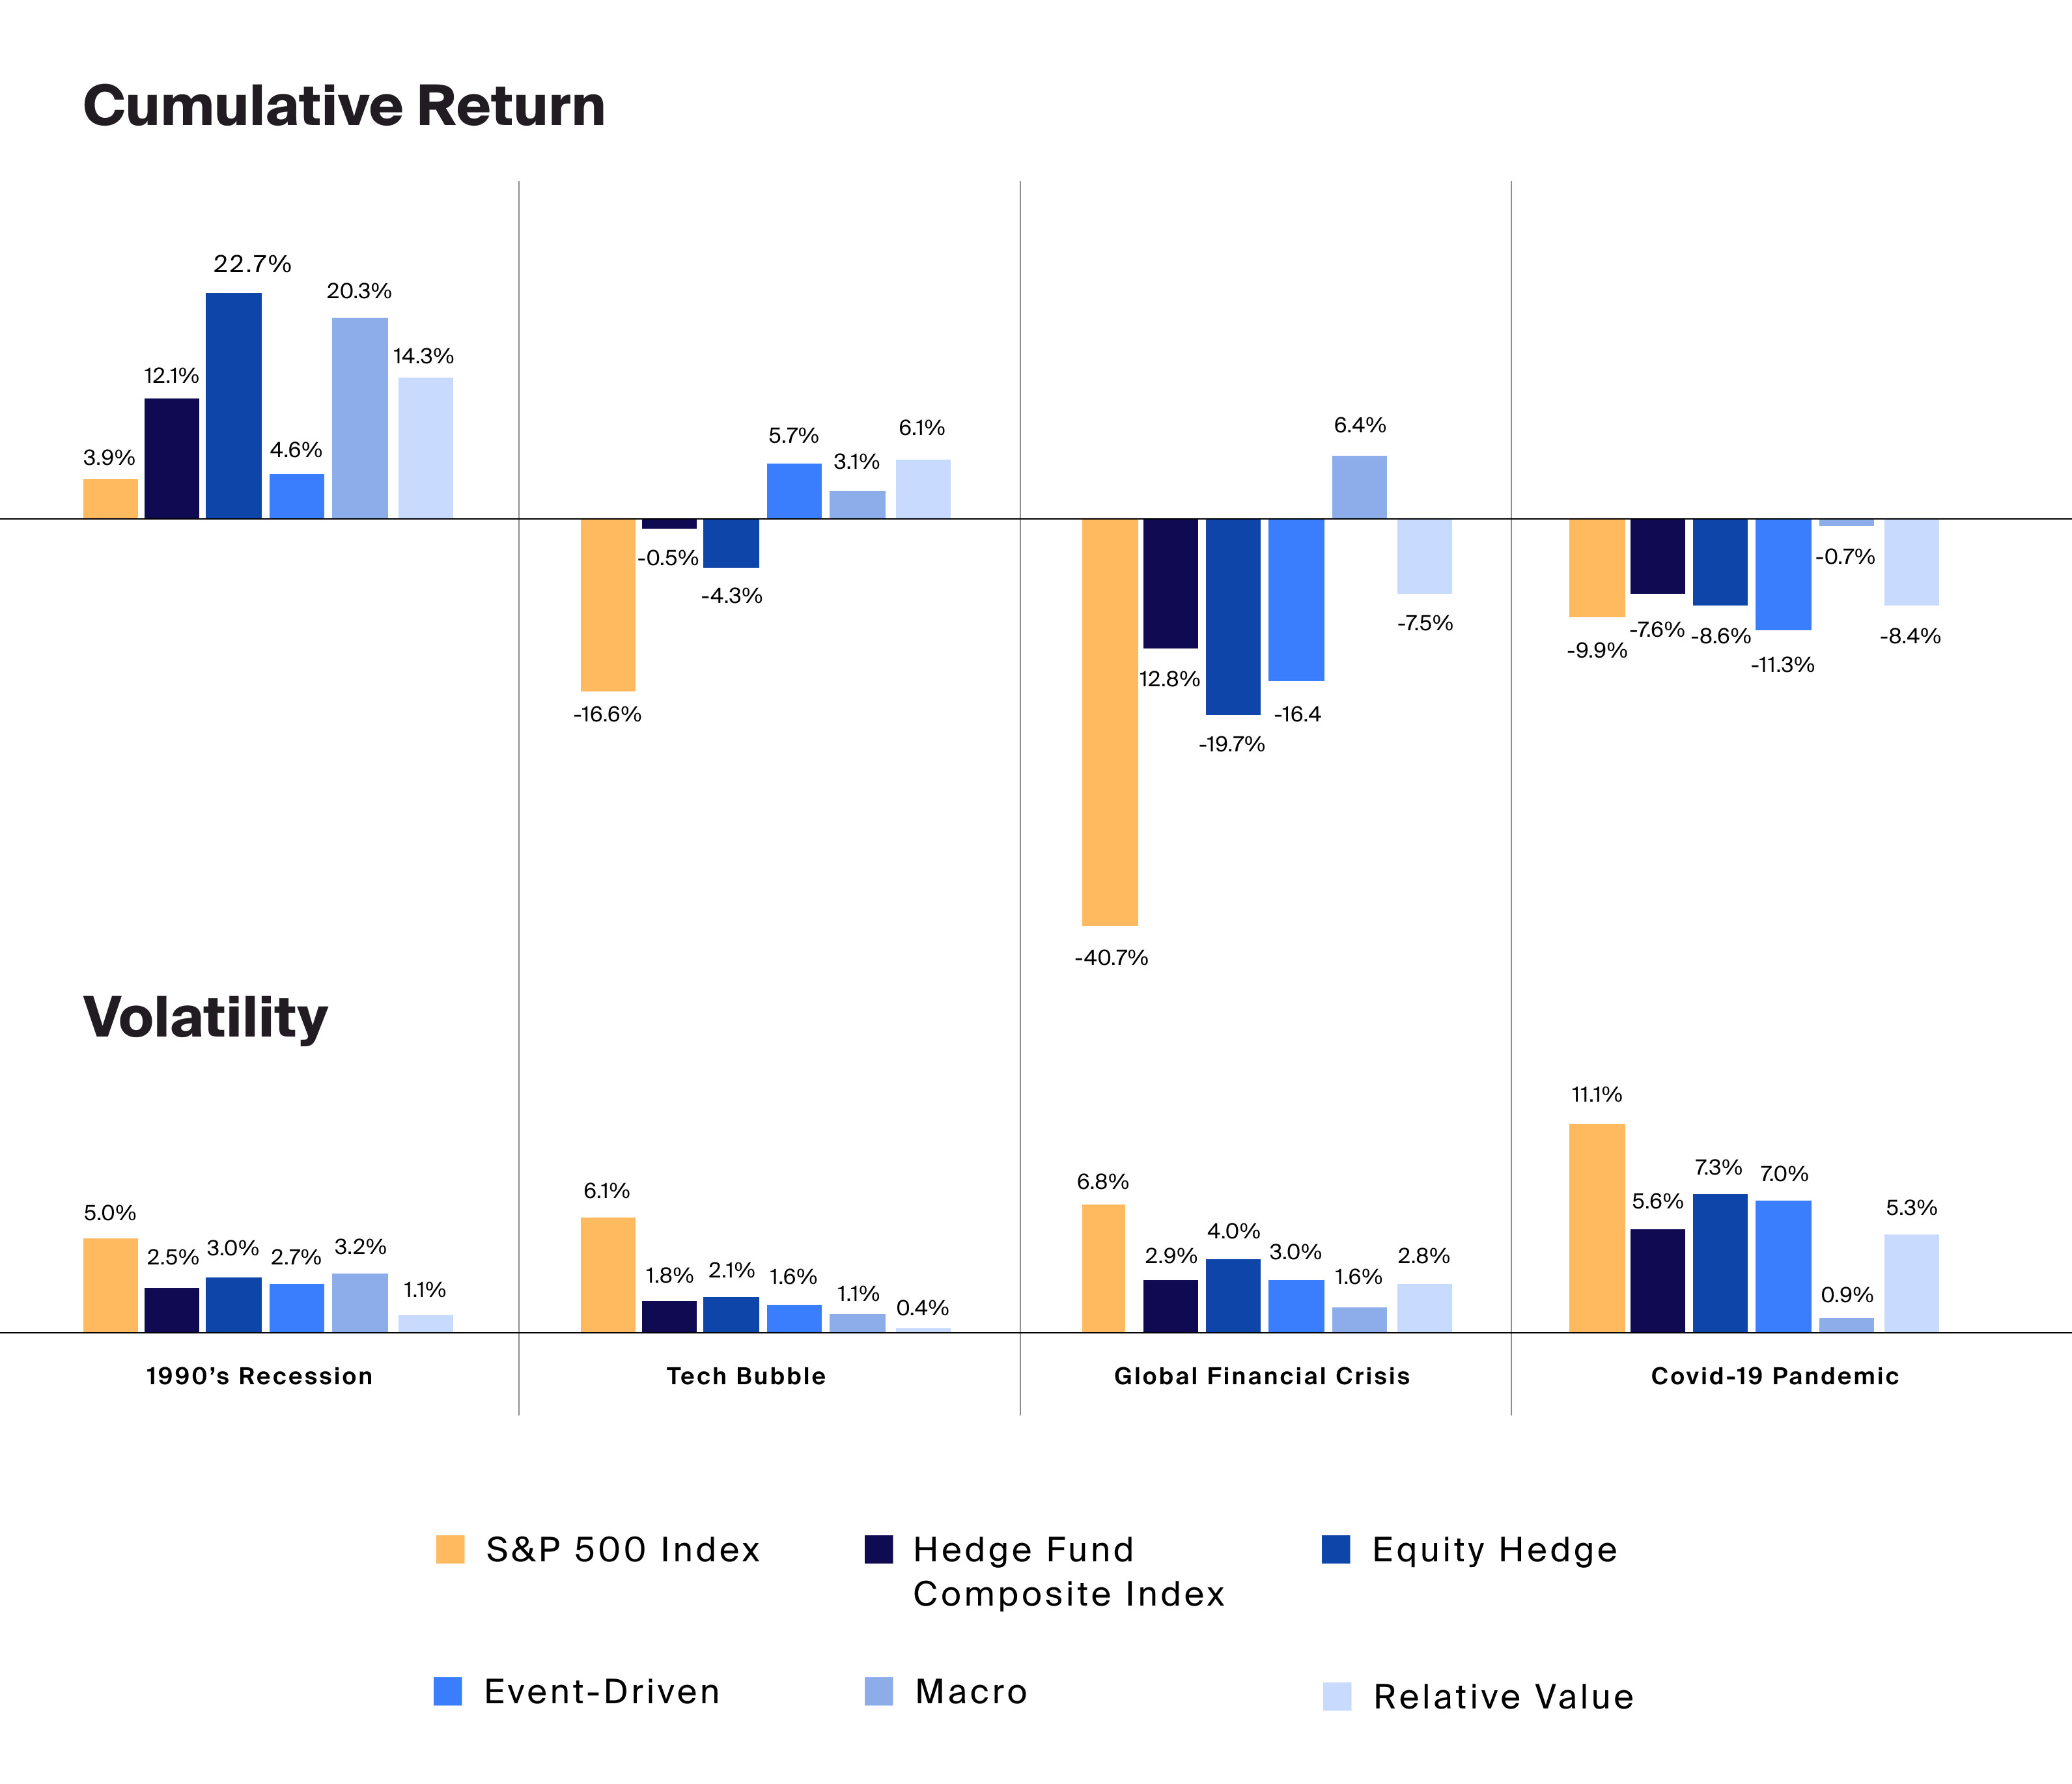
Compared to traditional equities, hedge funds may provide improved risk-adjusted returns and downside protection that investors may seek as the uncertainty of an economic downturn looms. Historically, hedge funds have outperformed the S&P 500 through recessions and in some cases have provided a source of considerable excess return, while taking on considerably less risk from a volatility perspective (Exhibit 4).

Source: Bloomberg, S&P 500 Index represented by the SPX Index, HFR, Hedge Fund Composite Index represented by HFRIWI, Equity Hedge represented by HFRIEHI, Event-Driven represented by HFRIEDI, Macro represented by HFRIMI, Relative Value represented by HFRIRVA, recession periods determined by USRINDEX Index, as of 7/31/2022.
Compared to traditional equities, hedge funds may provide improved risk-adjusted returns and downside protection that investors may seek as the uncertainty of an economic downturn looms. Historically, hedge funds have outperformed the S&P 500 through recessions and in some cases have provided a source of considerable excess return, while taking on considerably less risk from a volatility perspective.
What’s more, hedge funds typically have an expanded toolbox compared to traditional equity strategies. Their ability to take on short positions, utilize leverage, and access other asset classes and derivatives enables them to seek to take advantage of shifts in volatility and potentially benefit from greater dispersion in the performance of different assets. From a portfolio construction perspective, hedge funds may provide a source of portfolio resilience in unpredictable market conditions. Investors should be aware of additional risks when investing in hedge funds, including but not limited to liquidity restrictions, less regulation and more complex investment vehicles compared to publicly traded mutual funds and exchange traded funds.
Protection Notes
In periods of economic uncertainty, investors are often focused on capital preservation and the ability to secure an investment in the event of downside in the public sector or slowing growth on a macroeconomic level. Protection notes are engineered to secure a certain portion of principal with the opportunity to participate in the appreciation of underlying assets such as equities or commodities. Floored notes and MLCDs (Market-Linked Certificates of Deposit) seek to utilize these capital preservation strategies and may provide investors a source of alternative yield.
Opportunistic, Special Situations and Distressed Debt
Tightening financial conditions and persistently high inflation have increased pressure on companies. Investors may consider positioning portfolios to seek to take advantage of an opportunity set in stressed and distressed securities that may expand if more and more companies begin to encounter financial difficulty.
Opportunistic credit, special situations and distressed debt funds typically seek out companies that are undergoing financial hardship. These funds utilize a variety of strategies, including restructuring, becoming equity owners, or realizing a relatively higher private market valuation versus the public market. This differentiated return stream may be another more proactive approach to potentially diversify a traditional asset allocation and may enhance a portfolio’s risk-adjusted returns.
While the Fed continues to assert that the U.S. is not presently experiencing a recession—citing an “extremely tight” labor market and the lack of “broad-based decline across many industries”19 —investors may consider constructing more resilient and risk-adjusted portfolios to ward off growing uncertainty.


