As an asset class, hedge funds are generally known for employing more complex and flexible investment tactics than other investment types. They can go long. They can go short. They can lever up. They also have relatively fewer limits on the investment methods they can use, the geographies or sectors they can cover, or the types of assets they can include in their portfolios.
Yet, while hedge funds themselves tend to be more tactical in their own investing—often focusing on market timing, relative values and shorter-term trades—their potential value in broader portfolios may be more evergreen and strategic.
Due to their tendency towards niche and sophisticated tactics, hedge funds have been looked upon by some as a vehicle for targeting differentiated returns. In the low interest rate environment of the last decade, however, hedge funds have largely underperformed public market indices like the S&P 500.1 As we seem to be heading towards potentially paradigmatic shifts in the investment landscape, we believe it’s worthwhile to reexamine the common goals of hedge funds and evaluate their historic performance across market environments in relation to these goals.
In a recent survey conducted by Cerulli Associates, 69% of financial advisors claimed that reducing public market exposure was a goal of their alternative investment allocations, and 66% selected volatility dampening or downside risk protection as an additional goal.2 Meanwhile, just 42% said they are looking to alternatives for enhanced returns.3 Our analysis, which includes over 30 years of performance data since inception of the HFR Composite Index in 1990, suggests that even as hedge funds have collectively produced lower returns than public markets since the Global Financial Crisis, they have seemingly been able to address two common goals of some advisors—diversifying away from public market exposure and offering downside risk protection—during periods of high public market volatility and shifting monetary policy. Importantly, hedge funds can generate their returns through leverage, concentration of positions and the ability to short and invest in derivatives, which may expose investors to higher-risk strategies as compared to passive, index-tracking strategies.
Assessing the Common Goals of Hedge Funds: Alpha Generation Versus Beta Minimization
Hedge fund managers’ tactical ability to invest across asset types and strategies may enable advisors to participate in a wide range of opportunities and uncertain economic environments with a relatively hands-off approach. While it may introduce significantly more risk, a hedge fund’s capacity to take both long and short positions also has the potential to drive return through market cycles. As our analysis later in this piece suggests, hedge funds’ adaptive strategies may also make them particularly capable of achieving a measure of downside protection and minimizing public market exposure.
To help advisors analyze the potential benefits of hedge funds against higher beta, long-only equity strategies, we assess the relative performance of the asset class in various U.S. market environments since 1990. We characterize these environments by the degree of both volatility in U.S. public markets and the shifting of monetary policy across rolling six-month periods. To seek to better understand the tactical impact of hedge funds’ strategies across these environments, we also broke down the HFRI’s alpha and beta contribution to its net returns. While generating alpha, or differentiated returns, is a key consideration for some advisors, beta exposure may also be an interesting metric for those who seek to build resilience into their portfolios. It’s a fund’s lower beta—or reduced public market exposure—that may represent its potential for greater downside protection. Still, to achieve that lower beta, hedge funds’ employment of higher risk strategies, like shorting, exposes their investors to different risks that may themselves lead to portfolio losses.
Hedge Funds in Different Volatility Environments
When public markets are relatively tranquil, hedge funds—and actively managed funds in general—tend to have less room to differentiate themselves.4 By contrast, when public markets are more volatile, there tends to be more dispersion in valuations,5 potentially creating more space for hedge funds to employ their niche tactics and seek out undervalued opportunities. Some hedge funds are willing to take on potentially outsized risk, such as additional leverage, to seek to amplify these opportunities. As the broader market suffers, price changes relative to long-term averages may also give hedge fund managers an opening.6
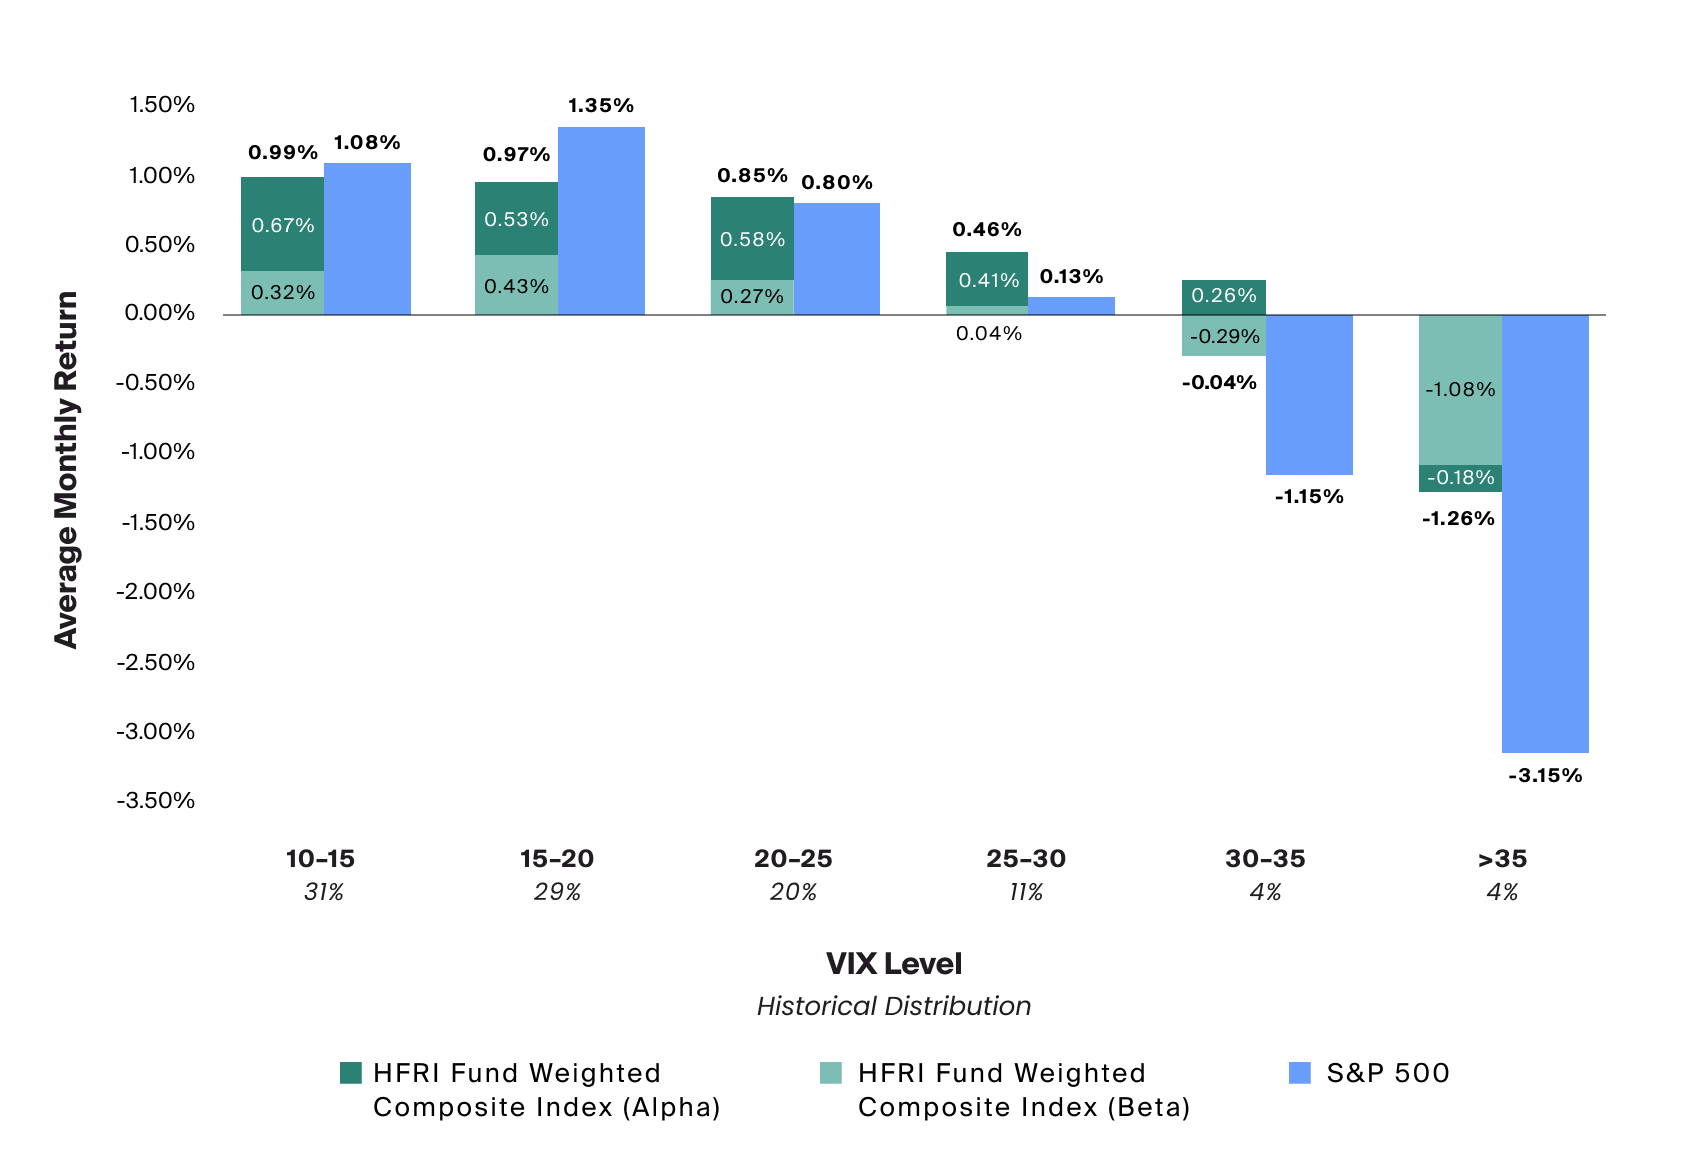
This dynamic seems to have played out during the time frames we analyze below. In periods of moderate to high volatility, as measured by the VIX Index, hedge funds on average generated higher monthly returns than U.S. public equities (Exhibit 1). By contrast, when the VIX was relatively lower, U.S. equities outperformed hedge funds. Hedge funds still managed to capture most (82%) of the total S&P 500 index return in lower volatility months in the 10-15 and 15-20 VIX ranges, with distribution weighted across periods.
To visualize, we have aggregated global hedge fund performance—represented by the HFRI—compared to the S&P 500 during periods of varying volatility levels. Next to the VIX ranges on the x-axis, we show the percentage of intervals within each range. It’s worth noting that these periods of moderate-to-high volatility, during which hedge funds outperformed, account for nearly 40% of the data set. An advisor may seek to benefit from the potential portfolio protection that hedge funds aim to offer during unexpected—yet historically somewhat frequent—periods of high volatility. Yet, to do so, they may have to accept that hedge fund returns may be lower than public market returns the rest of the time.

Source: Bloomberg, S&P 500 represented by rolling 6-month average of the SPX Index; volatility represented by the VIX Index and percent distribution of periods is the occurrence of each range over the total period. HFRI, HFRI Fund Weighted Composite Index (Beta) calculated from rolling 6-month average S&P 500 beta contribution to return; HFRI Fund Weighted Composite Index (Alpha) calculated from rolling 6-month average S&P 500 alpha contribution to return. All data fall in the range of January 1990 – September 2022.
We have aggregated global hedge fund performance—represented by the HFRI—compared to the S&P 500 during periods of varying volatility levels. Next to the VIX ranges on the x-axis, we show the percentage of intervals within each range. It’s worth noting that these periods of moderate-to-high volatility, during which hedge funds outperformed, account for nearly 40% of the data set. An advisor may seek to benefit from the potential portfolio protection that hedge funds aim to offer during unexpected—yet historically somewhat frequent—periods of high volatility. Yet, to do so, they may have to accept that hedge fund returns may be lower than public market returns the rest of the time.
Hedge funds experienced negative average monthly performance in only the two highest-VIX periods, which accounted for only 8% of months in the last three decades. However, even at the extremes where the VIX was greater than 35, hedge funds experienced an average monthly return of –1.26% while the S&P 500 returned –3.15% on average during the same periods, demonstrating a measure of downside protection.
In periods accounting for nearly 92% of the dataset, alpha contributed more to hedge fund returns than beta. This seems to suggest that a larger portion of overall hedge fund returns were achieved through differentiated return than through exposure to the market. During the higher and rarer (8%) periods when the VIX is greater than 30, beta contribution was greater than alpha contribution. It appears to us that in these more volatile periods, hedge funds’ ability to deliver differentiated returns was hampered by more pervasive, macro-driven market movements. Even so, because their market exposure was still limited, hedge funds performed better during these periods than the broader market. Based on this analysis, it appears that hedge funds have collectively provided more benefit with respect to the goals of reducing public market exposure and dampening the effects of broader market volatility.
Hedge Funds in Changing Monetary Environments
In addition to periods of higher volatility, periods of changing monetary policy may similarly introduce potential opportunities for hedge funds to generate differentiated returns and minimize public market exposure. Like market volatility, shifting monetary policy has coincided with greater headwinds for public markets such as repricing of risk assets and elevated volatility, which in combination may cause further dispersions7—potentially opening the door for hedge fund tactics that aim to capture differentiated return.
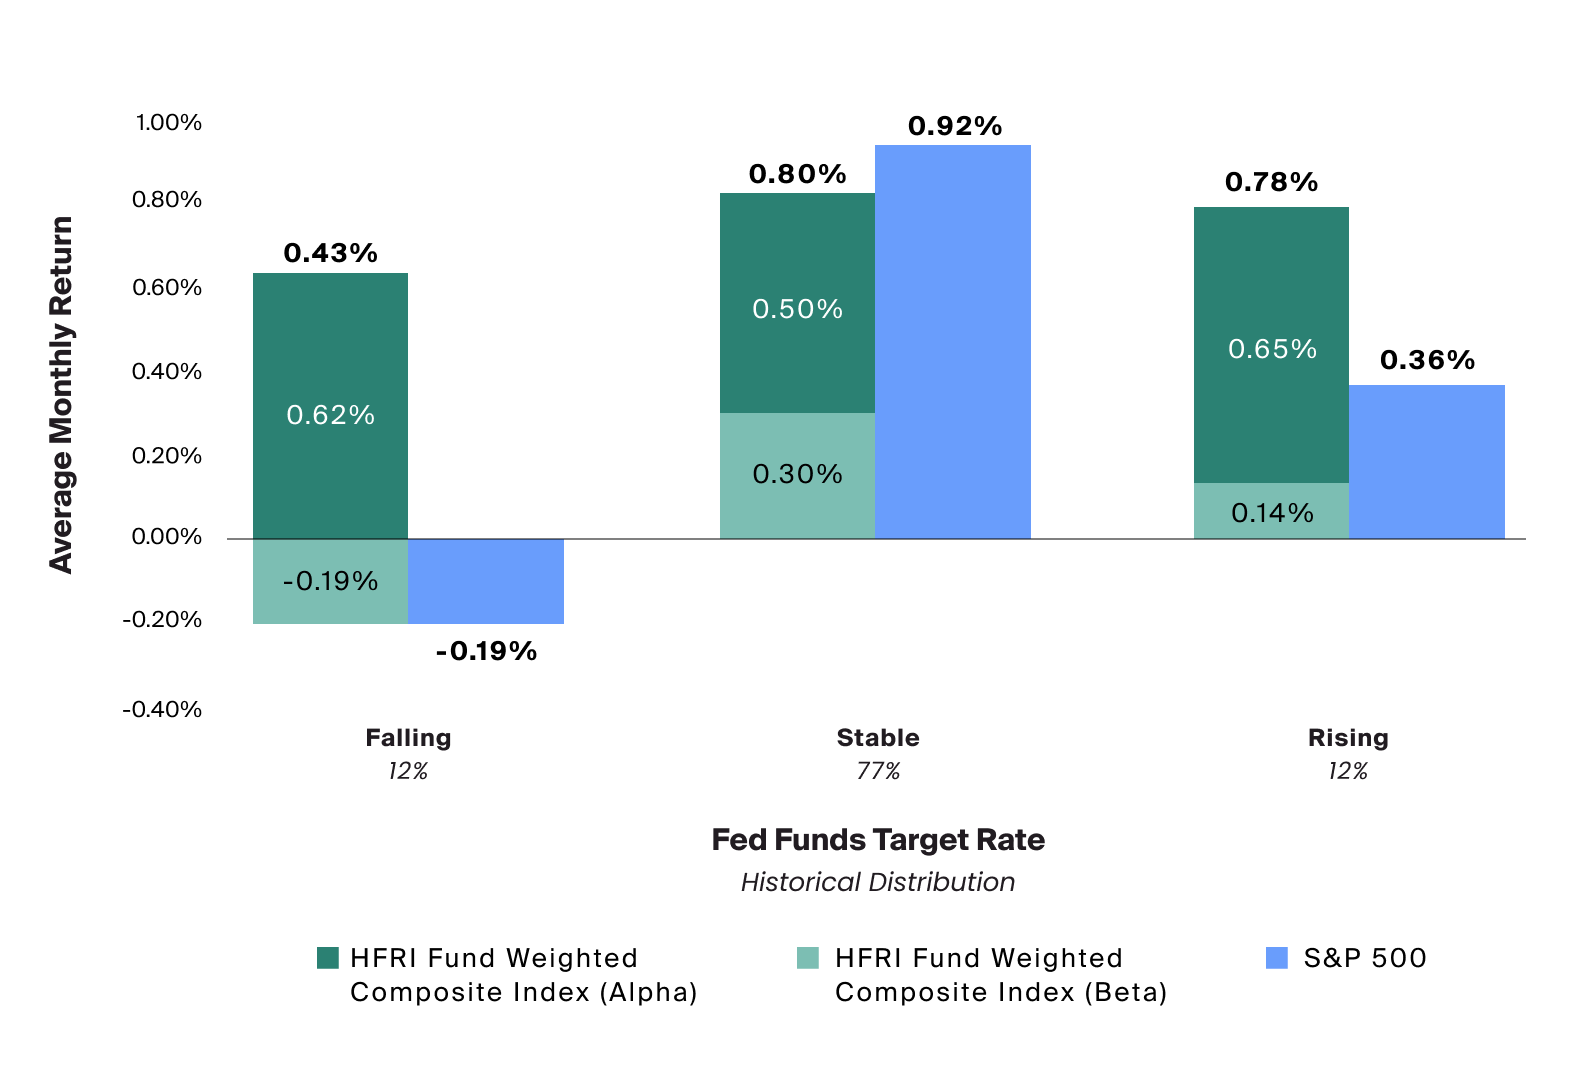
During the three decades included in this analysis, the S&P 500 outperformed hedge funds in stable monetary environments (occurring in 77% of the months we analyzed), when the federal funds rate remained unchanged. During these unchanging environments, hedge funds were still able to deliver 87% of the average monthly return of the broader market. However, in the remaining 24% of periods when the Fed tightened or eased policy, hedge funds tended to generate more alpha, outperforming equities at a distribution-weighted average of 0.61% compared to the S&P 500 which returned 0.08% in those changing monetary policy environments.

Source: Bloomberg, rolling 6-month average S&P 500 return represented by SPX Index; falling, stable and rising periods represent monthly change to the Federal Funds Target Rate Index; percent distribution of periods calculated by the count of each range over the total periods. HFRI, HFRI Fund Weighted Composite Index (Beta) calculated from rolling 6-month average S&P 500 beta contribution to return; HFRI Fund Weighted Composite Index (Alpha) calculated from rolling 6-month average S&P 500 alpha contribution to return. All data fall in the range of January 1990 – September 2022.
The S&P 500 outperformed hedge funds in stable monetary environments (occurring in 77% of the months we analyzed), when the federal funds rate remained unchanged. During these unchanging environments, hedge funds were still able to deliver 87% of the average monthly return of the broader market. However, in the remaining 24% of periods when the Fed tightened or eased policy, hedge funds tended to generate more alpha, outperforming equities at a distribution-weighted average of 0.61% compared to the S&P 500 which returned 0.08% in those changing monetary policy environments.
Until only recently, the U.S. has enjoyed a relatively stable monetary environment, during which the cost of the downside protection offered by hedge funds has not appeared worthwhile. So far in 2022, we’ve seen the fastest rate hikes in nearly three decades, potentially underscoring the utility of a portfolio hedge in our current environment.
Bringing It All Together
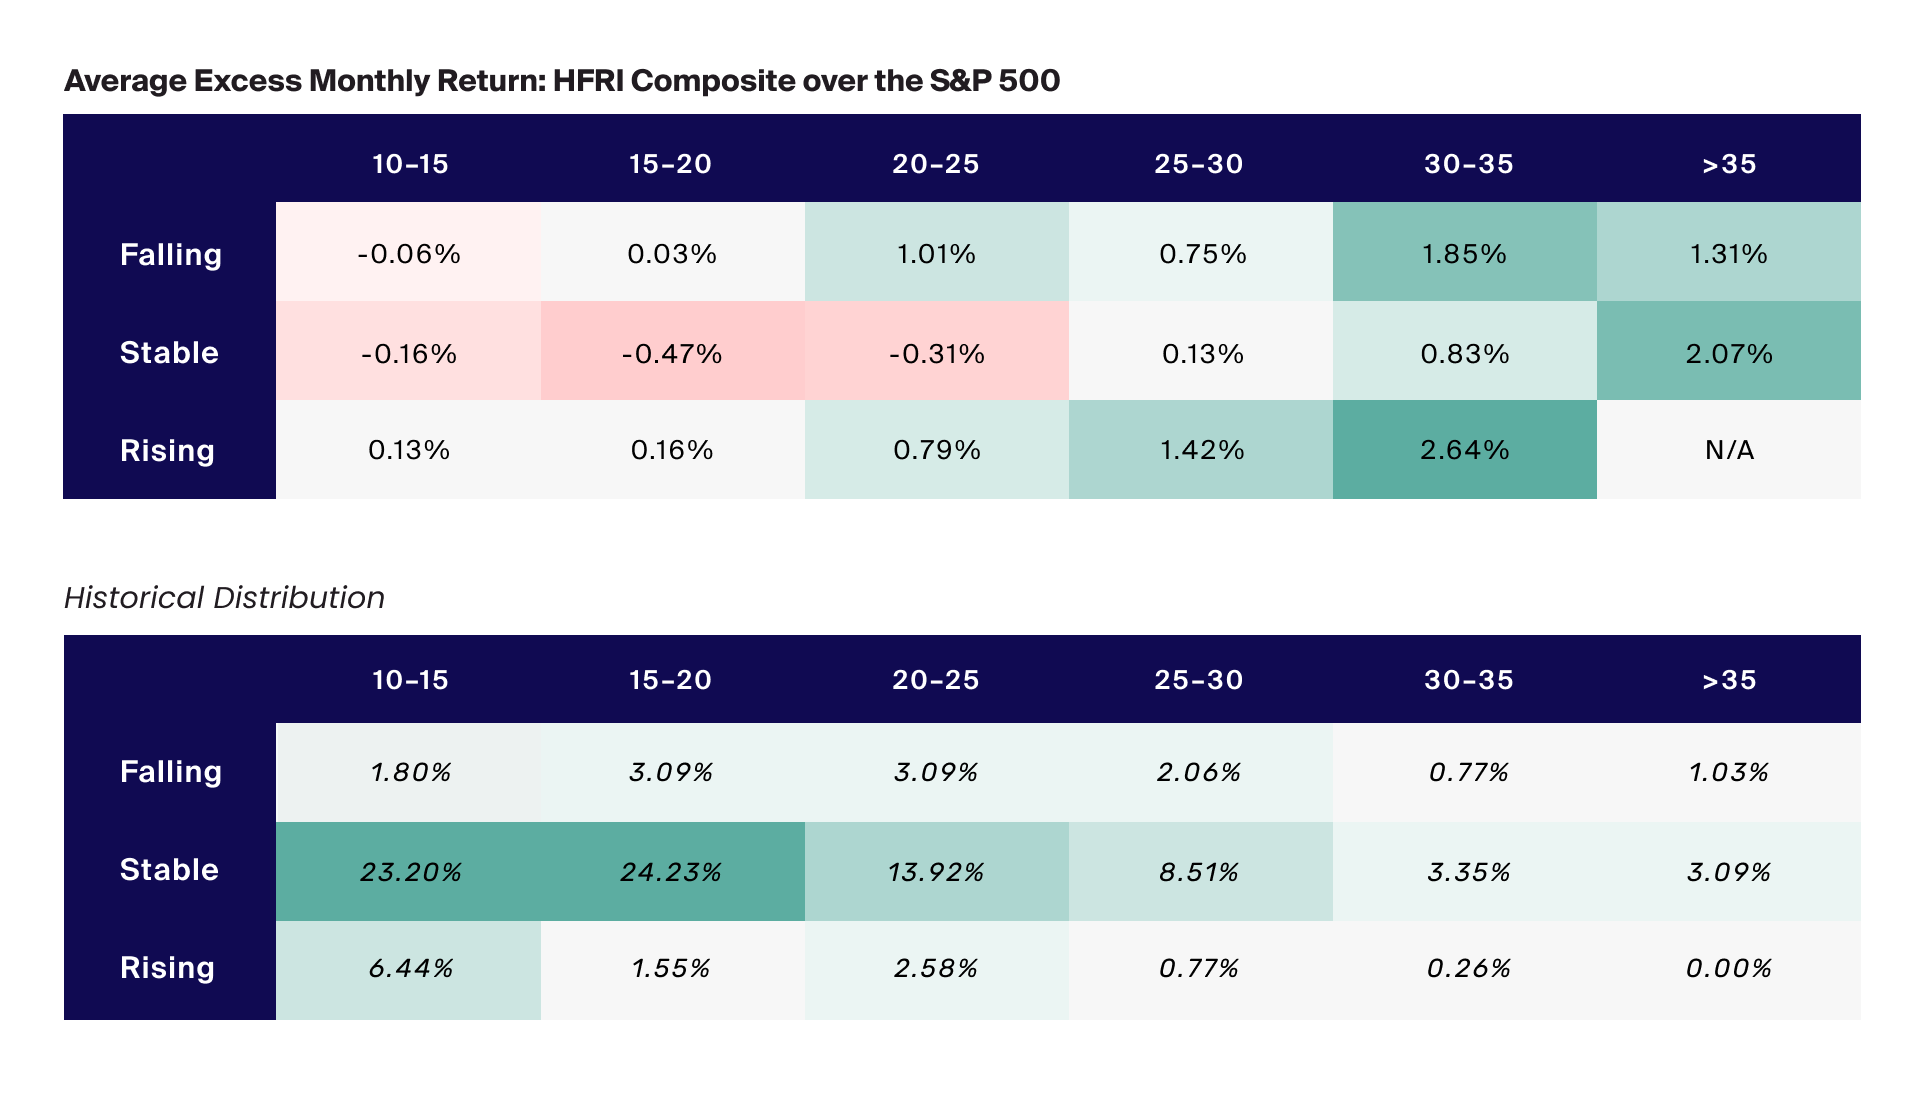
Next, we mapped out excess returns to explore the potential benefit of hedge funds when these varying market environments overlap. The excess return is the aggregate return of the HFRI less the return of the S&P 500 within each time period. In the first table below, negative excess returns indicate periods during which the S&P 500 outperformed the HFRI in terms of total average monthly return; positive values indicate HFRI outperformance. The bottom table represents the percentage of the time frame that each intersecting period occurred, which may help to show the relative frequency of each type of environment.

Source: Bloomberg, rolling 6-month average S&P 500 Return represented by SPX Index; volatility represented by the VIX Index; Percent distribution of periods is the count of each range over the total periods; falling, stable and rising periods represented monthly change to the Federal Funds Target Rate Index with the percent distribution of periods calculated by the count of each range over the total periods; excess return calculated by taking the average monthly return of the S&P 500 less the sum of HFRI beta and alpha contribution to return. HFRI, HFRI Fund Weighted Composite Index (Beta) calculated from rolling 6-month average S&P 500 beta contribution to return, HFRI Fund Weighted Composite Index (Alpha) calculated from rolling 6-month average S&P 500 alpha contribution to return. All data fall in the range of January 1990 – September 2022.
We mapped out excess returns to explore the potential benefit of hedge funds when these varying market environments overlap. The excess return is the aggregate return of the HFRI less the return of the S&P 500 within each time period. In the first table below, negative excess returns indicate periods during which the S&P 500 outperformed the HFRI in terms of total average monthly return; positive values indicate HFRI outperformance.
A clear trend emerges as we combine these periods. Note in darker green, the excess return generated during periods of overlapping higher VIX levels and in rising and falling monetary environments indicate periods where the HFRI outperformed the S&P 500. When compared with the second table, however, we see that these periods made up a smaller proportion of the overall time frame we analyzed. Equities were more likely to outperform hedge funds as negative—although relatively modest in magnitude—excess returns appeared more frequently. However, as we move upward, downward and to the right, into the periods of higher volatility and less stable monetary policy, the excess return of hedge funds grows. Though these periods occur much less frequently, the minimization of public market exposure and the measure of downside protection historically achieved by hedge funds may have the potential to complement equity exposures.
Data Considerations and the Current Environment
Financial advisors should remember that although hedge funds in aggregate seemed to limit exposure and offer some protection in certain periods over the past three decades, the HFRI Composite is not an investable benchmark and any individual fund may not have achieved the same goals during these timeframes. More specifically, the performance data of hedge fund indices can be skewed positively by survivorship bias due to unsuccessful funds and their related data being removed from the index over time.8 In other words, not all tactical allocation is effective in these ways, and careful manager selection can be important for those who seek to access the potential benefits that we discuss. Because of their sophisticated trading practices and use of leverage, hedge funds at large are also generally riskier than other traditional and alternative asset classes; therefore, any allocation into a hedge fund may run the risk of losing some or all capital invested.
We also want to note a few considerations with respect to the data we used in our analysis. For one, the dataset on hedge funds we used was limited; therefore, we could not compare performance before 1990. Also, the rising, stable and falling monetary periods are captured based on adjustments to the federal funds target rate at month end for each individual period and do not depict broader tightening or easing campaigns. Additionally, performance for the S&P 500 Index and the HFRI Index are six-month rolling averages and are compared to single instantaneous month-end values for the VIX index and federal funds target rate at the end of each rolling period, thus capturing a smoother and broader range of return data.
Given this analysis, we can begin to consider our current macro environment and where we are headed. Public markets remain volatile9 under the pretense of a potential economic downturn amidst rising interest rates and high inflation. As we saw here, these periods of elevated volatility and monetary instability tend to create the conditions, such as inter- and intra-asset class dispersion, that may provide a greater opportunity set for hedge funds to generate differentiated returns.


