Some fixed-income investors may take on additional risks, such as interest-rate risk or credit risk, when seeking enhanced yield in their portfolios. With greater access to alternative investment strategies, financial advisors may now have an opportunity to differentiate their sources of risk when seeking to achieve their desired level of yield.
What you’ll learn
Taking on differentiated sources of risk may give investors the opportunity to pursue enhanced yield when constructing more diversified portfolios.
While interest-rate risk and credit risk are commonly associated with traditional fixed-income investing, income-generating alternatives may assume differentiated risks such as illiquidity and tail risk, for which an investor may be compensated through yield.
Direct lending may be an income-generating alternative that has the potential to deliver a risk-based premium on illiquidity.
Contingent yield notes can offer yield through the payment of coupons dependent on the performance of underlying securities, taking on tail risk of equity or other markets to generate enhanced yield.
However, given the wide variety of strategies, terms, and components, advisors must ensure their clients understand several key risks related to structured notes, including credit risk related to the issuer, a potential lack of secondary market, and potential caps on upside participation.
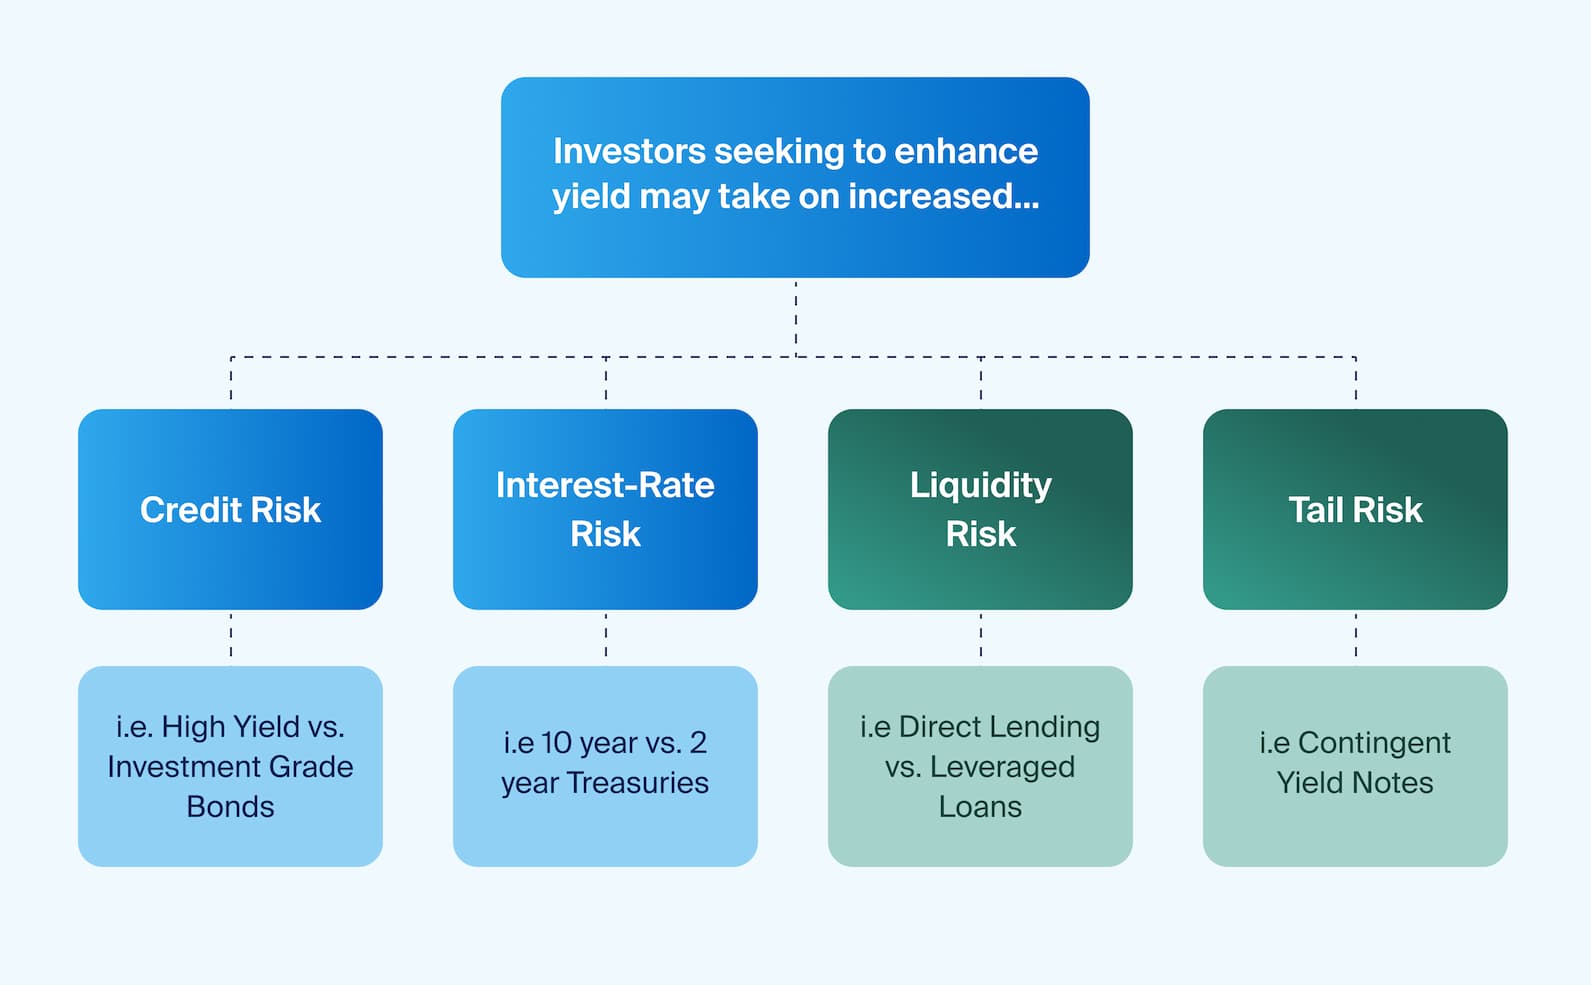
This article focuses on the different types of risks that advisors may encounter when seeking yield in their client portfolios, along with some alternative strategies that may enable investors to take on a differentiated set of risks to achieve enhanced yield. We focus first on the risks typically associated with traditional fixed-income securities—such as interest rate risk and credit risk—and then introduce some additional risks—such as illiquidity risk and tail risk—associated with certain alternative investments.
Footnotes
This graphic is for discussion purposes, and illustrative purposes only and is only intended for those that meet the threshold requirements of FINRA Rule 4512(c). This graphic does not constitute investment advice, or an offer, or a solicitation of an offer to buy or sell securities and/or any other financial instrument or product. CAIS makes no representation or warranty with respect to the information contained herein, and this graphic should not be relied upon in connection with any business or investment decision. This communication is not, in any way, intended for retail customers. Financial advisors are strongly encouraged to consider all applicable risks before making an investment decision.
The different types of risks that advisors may encounter when seeking yield in their client portfolios, along with some alternative strategies that may enable investors to take on a differentiated set of risks to achieve enhanced yield.
Interest-Rate Risk
Interest-rate risk is one of the risks most associated with traditional fixed-income securities, like US Treasury bonds for instance.[1] When interest rates increase or decrease, the price of fixed-income securities tends to move in the opposite direction. The extent of the price change will typically depend on the security’s duration, or the approximate number of years it takes for an investor to be repaid a bond’s price by the bond’s cash flows.
Securities with extended durations are typically more responsive to changes in interest rates than those with shorter durations. Thus, longer-term securities may compensate for the greater exposure to interest-rate risk.
Term premiums compensate an investor for taking on the risk that interest rates may fluctuate over the term of a bond.[2] The term premium, along with expectations of future short-term Treasury yields, typically make up the value of a Treasury security.
Source: Bloomberg, Venn, US long Treasury represented by Bloomberg US Long Treasury Total Return Index, US Short to Intermediate Treasury represented by Bloomberg US Treasury 1-5 Yr. Total Return Index, Yield Spread is calculated by the simple difference between the yield to maturity of the two indices, drawdowns are built utilizing Venn analysis, as of April 2023.
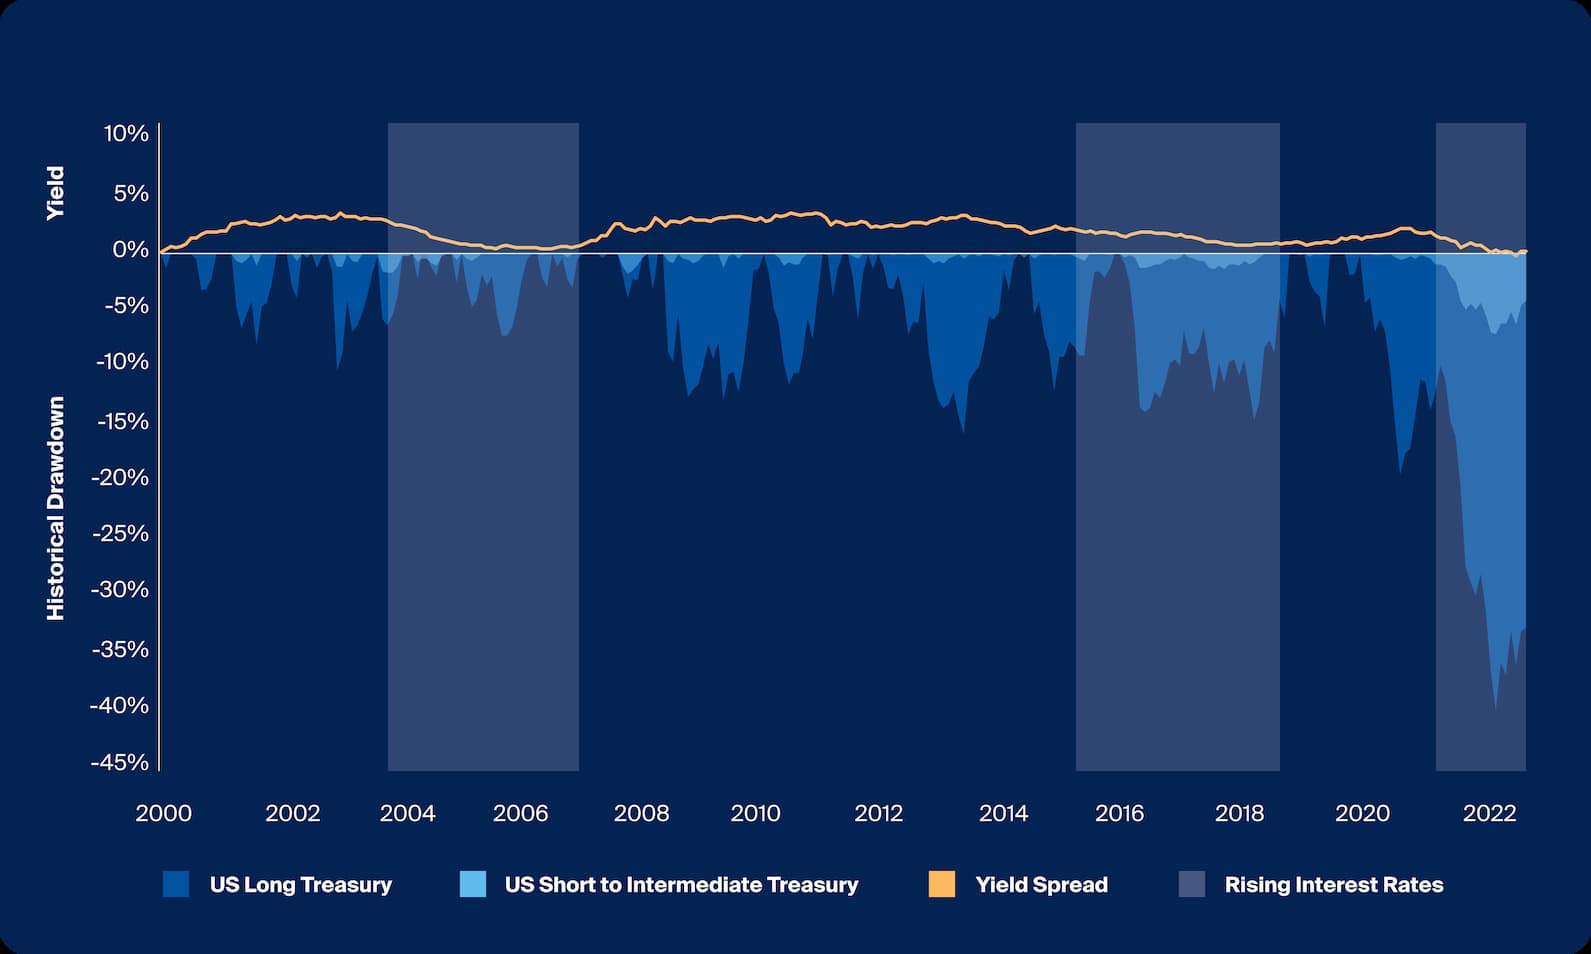
Over the course of the historical period above, long-dated treasuries generated a yield 163 basis points greater than that of shorter-term treasuries, indicating the additional compensation awarded for taking on greater interest-rate risk.
Over the course of the historical period above, long-dated treasuries generated a yield 163 basis points greater than that of shorter-term treasuries, indicating the additional compensation awarded for taking on greater interest-rate risk (Exhibit 2). This spread did fluctuate over time and notably has gone to zero or become negative in situations in which the yield curve inverted. Investing in longer-duration bonds also exposed investors to significantly greater drawdowns compared to their shorter-duration counterparts, particularly in rising-rate environments.
Credit Risk
Investors seeking to enhance yield may also take on additional credit risk, or the potential for losses to arise from the borrower defaulting on payment. This risk is typically measured by credit spreads, the difference between the yields of fixed-income securities of the same maturity and differing credit quality.[3] Investors may expect to be compensated with a higher yield to account for this higher risk of default.
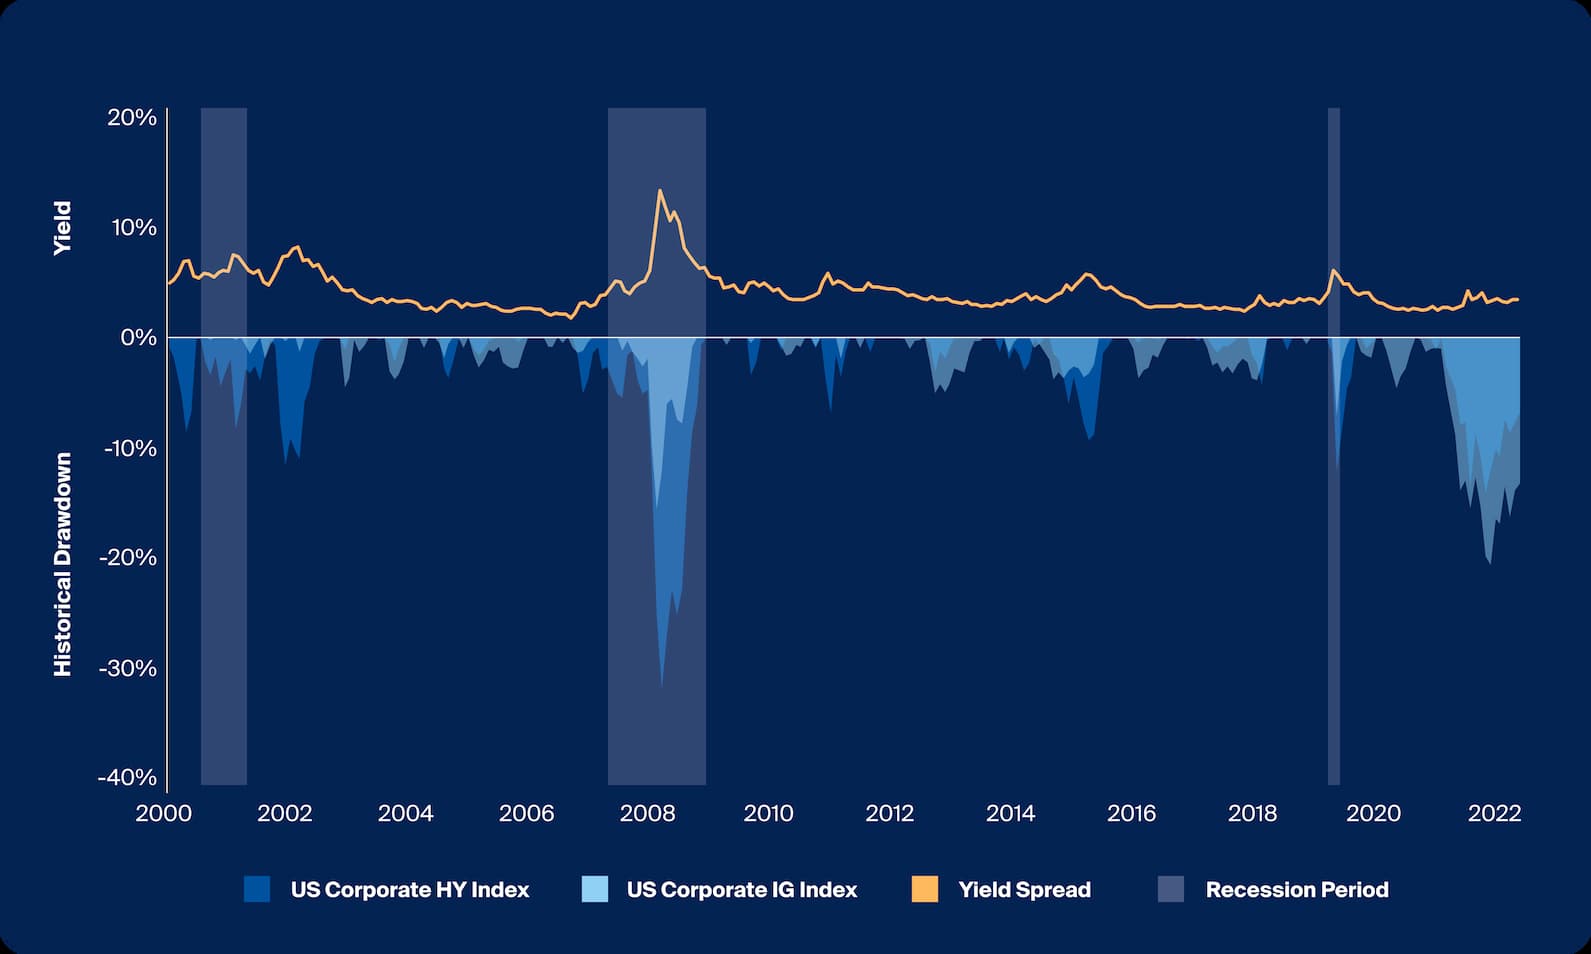
To visualize, we can compare corporate high-yield and corporate investment-grade fixed-income indices over time, measuring the yield spreads and drawdowns over time. Across economic cycles the increase in spread often coincided with a drawdown in bond prices and recession, indicating periods with a greater probability of default for lower-quality issuers.
Source: Bloomberg, Venn, US Corporate HY Index represented by Bloomberg US Corporate High Yield Total Return Index, US Corporate IG Index represented by Bloomberg US Corporate Total Return Index, Yield Spread is calculated by the simple difference between the yield to maturity of the two indices, drawdowns are built utilizing Venn analysis, as of April 2023.
Over the course of the period above, high-yield bonds generated on average 411 basis points of yield in excess of investment-grade bonds.
Over the course of the period above, high-yield bonds generated on average 411 basis points of yield in excess of investment-grade bonds (Exhibit 3). It’s worth noting that the average duration of investment-grade bonds included in the Bloomberg US Corporate Investment Grade Index (IG Index) was 7.14. The duration of the Bloomberg US Corporate High Yield Index (HY Index) was lower at 3.61, meaning investing in investment-grade corporates as measured by the index exposed investors to greater interest-rate risk despite lower credit risk than high-yield corporates.[4] This may explain the most recent period in which investment-grade bonds had a greater drawdown than high yield due to their greater interest-rate sensitivity and the fastest Fed rate hikes in decades.[5] In contrast, the HY Index reached a drawdown of 33% during the Global Financial Crisis, far exceeding that of the IG Index which drew down as much as 15%, indicating credit risk was a much greater focus than the most recent period of volatility.
Liquidity Risk
Investors seeking yield may also be compensated for taking on additional liquidity risk, which refers to an investor’s inability to sell a bond quickly and at an efficient price, measured by the spread between its ask price and its bid price or selling at a price below intrinsic value.[6] High-yield bonds, for example, may be subject to more liquidity risk than investment-grade corporates, and investment-grade corporates more than US Treasury bonds.
Like credit risk and interest-rate risk, the risk associated with illiquidity may in some cases compensate investors through enhanced yield. This is typically referred to as a liquidity (or illiquidity) premium.[7] The difference in liquidity at the security level is heightened for direct loans, which are virtually all held to maturity—as such there is a lack of a robust secondary market.[8]
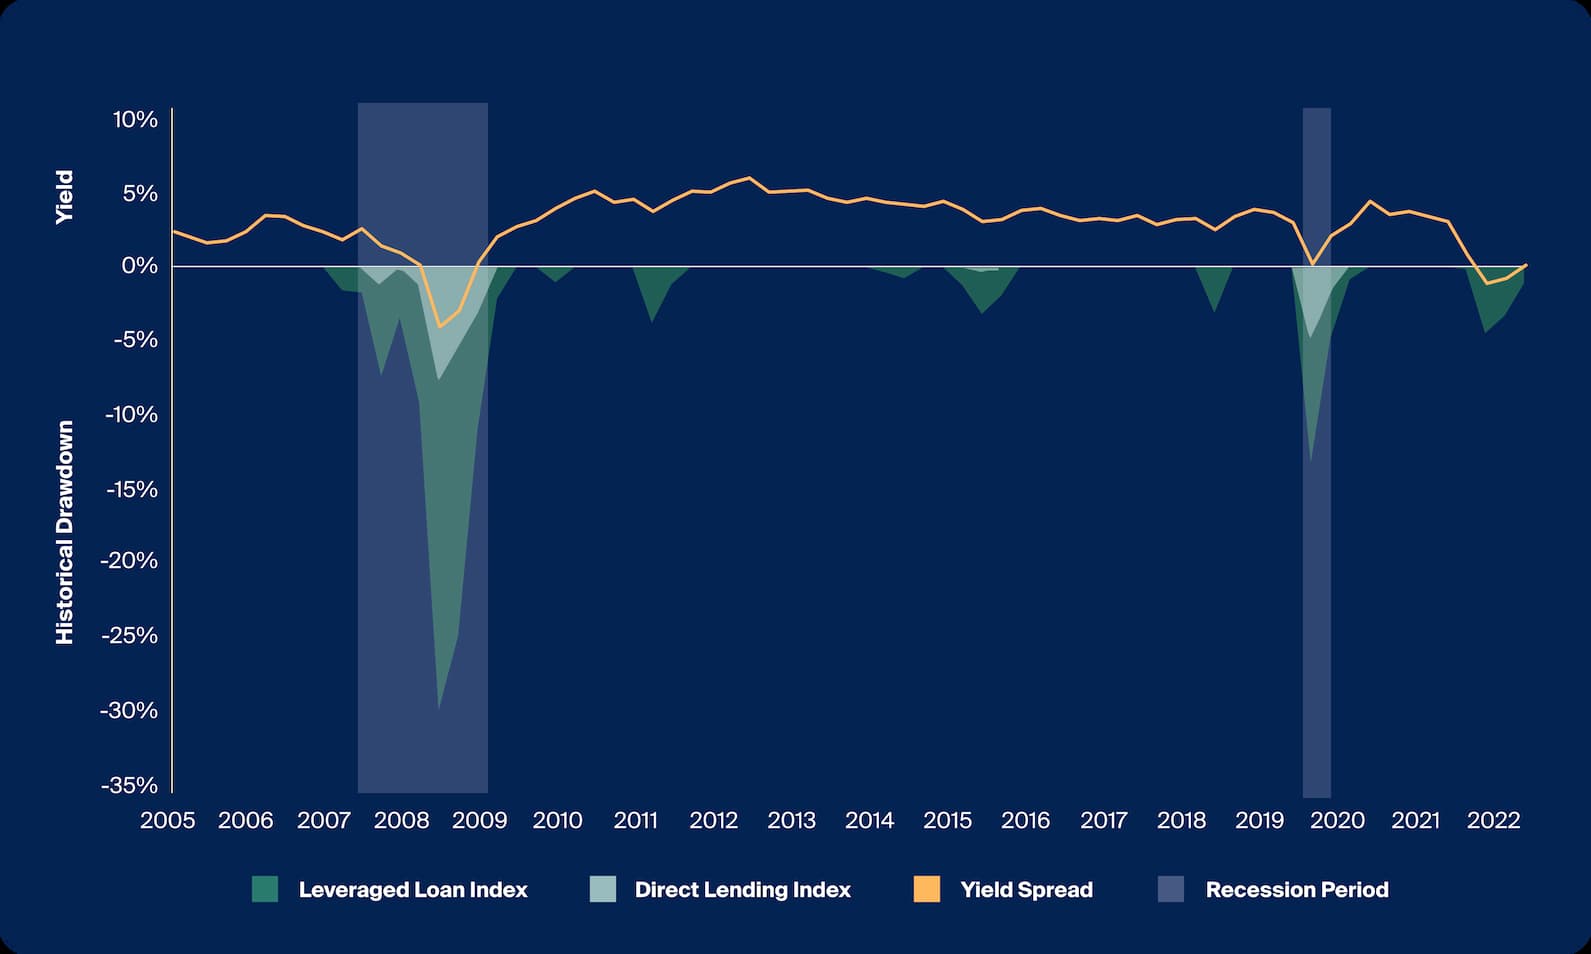
To illustrate the yield premium that may have been available to investors in private credit, we analyzed the spread between yields in direct lending compared to leveraged loans, for which there is a robust secondary market with over $800 billion in volume traded in 2022,[9] as well as the differences in drawdowns.
Source: Bloomberg, Venn, Direct Lending Index represented by Cliffwater Direct Lending Total Return Index, Leveraged Loan Index represented by Credit Suisse Leveraged Loan Total Return, Yield Spread is calculated by the simple difference between the Cliffwater Direct Lending Income Return Index and the Credit Suisse Leveraged Loan Index Yield to Maturity, drawdowns are built utilizing Venn analysis, as of March 2023.
Over the course of the historical period above, direct lending generated a yield 283 basis points in excess of leveraged loans.
Over the course of the historical period above, direct lending generated a yield 283 basis points in excess of leveraged loans (Exhibit 4). This enhanced yield can be attributable to illiquidity, as direct lenders may have distinct advantages, such as greater overall control of negotiations and access to deals than those who issue leveraged loans. For instance, experienced direct lending managers, who directly negotiate their terms, may have greater deal access through relationships with sponsors, and preferred positioning within capital structures.[10][11] Direct lenders also tend to underwrite loans to smaller companies, which may also demand a greater rate of return.
The ”buy-and-hold” strategy and finite secondary market may have contributed to the limited drawdown in direct lending compared to leveraged loans in periods of public market volatility. Valuations for private credit are based on fair value and are generally therefore longer-term focused, as compared to publicly traded bonds which have real-time pricing based on secondary market trading data and are marked-to-market.[12]
Tail Risk
Extreme, often unexpected events or movements in the market are known as tail risk events. Asset performance far above or below an average expected return describes the probability measure known as tail risk.[13] Left tail risk, in particular, refers to outsized drawdowns, which may impact the performance of portfolios.[14] While tail risk is not commonly associated with traditional fixed income, financial advisors may now have an opportunity to achieve their desired level of yield by taking on differentiated sources of risk.
The graph below depicts the historical rolling three-year return distributions of three common public equity indices. The bars represent the frequency as a percentage of total observations and may be used to visualize how these indices have performed over rolling three-year periods since 1990. The total return in the distribution may depict the occurrence and magnitude of tail risk events for each index.
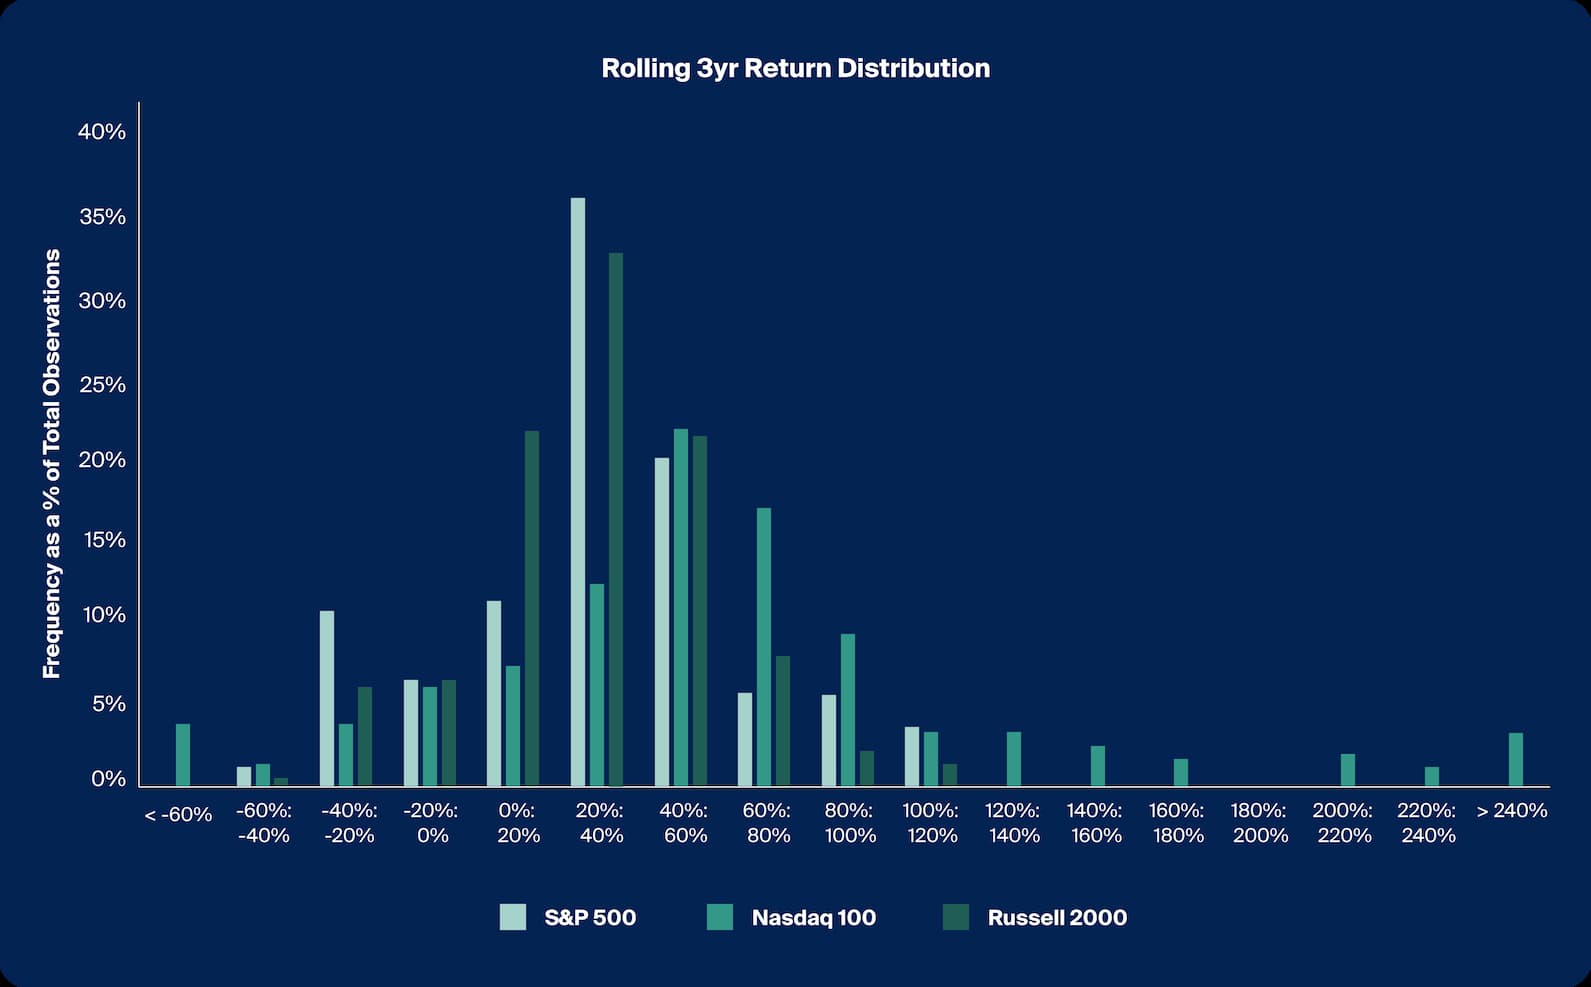
Source: Bloomberg, S&P 500 represented by S&P 500 Index, Nasdaq 100 represented by Nasdaq 100 Stock Index, Russell 2000 represented by Russell 2000 Index, Rolling 3yr Return Distribution is calculated by taking the rolling 3 year total return of monthly index data from January 1990 to April 2023, bins are evenly distributed and selected based on the distribution of the underlying data, tails are designed to capture all data available, as of April 2023.
The historical rolling three-year return distributions of three common public equity indices. The bars represent the frequency as a percentage of total observations and may be used to visualize how these indices have performed over rolling three-year periods since 1990. The total return in the distribution may depict the occurrence and magnitude of tail risk events for each index.
Contingent Yield Notes and Enhanced, Differentiated Yield
Structured notes may enable an investor to generate additional yield by taking on tail risk, differentiated from the three types of risk already more common in fixed-income investing. Contingent yield notes specifically are structured products designed to generate income that offer a coupon payment dependent on the price of an underlying security like the indices in Exhibit 5. Here are some attributes of these notes:
Performance-Based Thresholds: Contingency on underlier performance is engineered through performance-based thresholds such as barriers and buffers, which may trigger either coupon payments as yield or principal repayment at maturity. The maintenance of these thresholds is then based on the performance of the underlying investment and whether the thresholds are breached. Therefore, the assumed chief risk to generate a coupon yield is the tail risk of the underlying investment.
Custom Terms: Terms such as coupon payments will vary depending on which features may be included. While there may be a relationship between the coupon barrier and the coupon itself, there are many other factors that determine the terms of a contingent yield note. Terms previously discussed such as credit risk, maturity, underliers, liquidity, and even interest-rate risk may impact the expected coupon and ongoing performance of structured notes.
Differentiated Risks: While risks exist among structured notes, these trade-offs may have the potential to provide investors with opportunities for enhanced yield and supplemental differentiated income. Adding differentiated sources of risk, return, and income may add to the overall diversification of portfolios, and as we have shown, risks not commonly associated with traditional fixed income.
In general, structured notes have the potential to be a way for certain investors to meet income objectives However, given the wide variety of strategies, terms, and components, advisors, along with their clients, must understand several key risks that differentiate these investments from traditional securities.
For example, investors in structured notes are exposed to the credit quality of the issuer, and pricing and fees may differ. Structured notes may have a limited or no secondary market. Should an issuer offer liquidity, the price at which a structured note may be sold prior to maturity will depend on various factors and may be substantially less than the purchase price. Investors in notes also have no ownership of underlying securities and therefore are subject to the predefined return potential of the notes, including any caps on the upside. And, of course, purchasers of structured notes may lose some, or all of their principal investment. Investors should consult their investment, legal, tax, accounting, and other advisors prior to investing in structured products.


