The secondaries market has emerged out of its infancy and has grown in both size and complexity1 as investors seek more certainty in their exposure to private equity.2 Yet, with the growth of less conventional transactions and an unprecedented amount of capital flowing into the space,3 can the return drivers that precipitated the growth of secondaries persist?
In this article, we explored this question, investigating the impact of market growth on secondary transaction pricing, along with the implications of the growing share of secondary transactions led by GPs. We also compare the historical risk and return profile of PE secondaries funds to their primary fund counterparts.
We find, based on empirical evidence, that the secondary market is one in which the growth in the opportunity set has thus far outpaced the rapid entrance of new capital. In addition, the adoption of secondaries as a liquidity tool for GPs has increased the availability of high-conviction assets but introduces new considerations for investors interested in the space.4 Finally, our research suggests that secondary funds have delivered a higher median IRR and a narrower range of returns across strategies compared to investments in primary private equity funds.
Want to understand the basics of secondaries investments in PE? Read “An Introduction to Private Equity Secondaries,” part of our Introduction to Alternatives series.
Has Secondaries Growth Changed Pricing Dynamics?
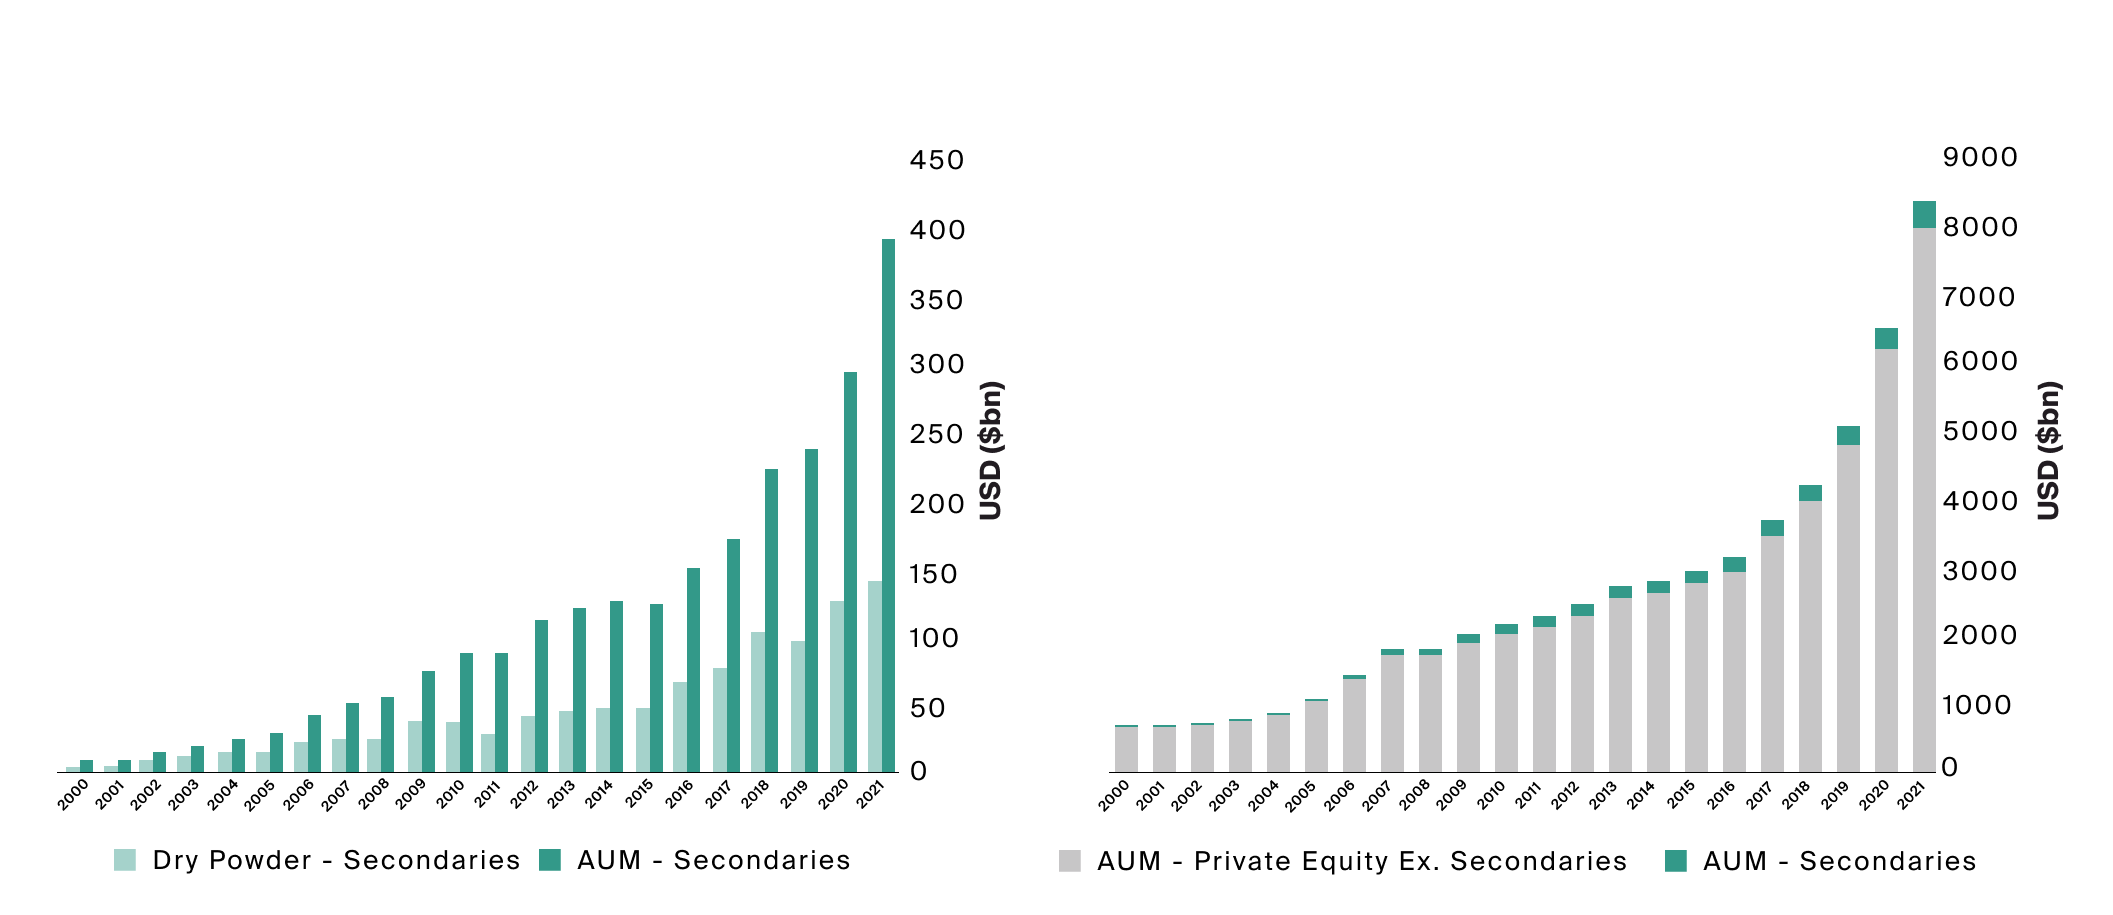
According to Preqin, AUM for secondary funds has quadrupled over the past 10 years and has grown at a compounded annual growth rate of 20.2% since 2000, outstripping the overall annual growth rate of private equity AUM at 12.9% over the same period (Exhibit 1). The growth of both markets has been supported by the long-term secular trend of companies staying private for longer,5 made possible by the expansion of access to private capital.6 Despite the aforementioned growth, the secondary market is still relatively small compared to the total private equity market, just 4.7% as of 2021 (Exhibit 1).
Source: Preqin, as of 12/31/2021.
According to Preqin, AUM for secondary funds has quadrupled over the past 10 years and has grown at a compounded annual growth rate of 20.2% since 2000, outstripping the overall annual growth rate of private equity AUM at 12.9% over the same period.
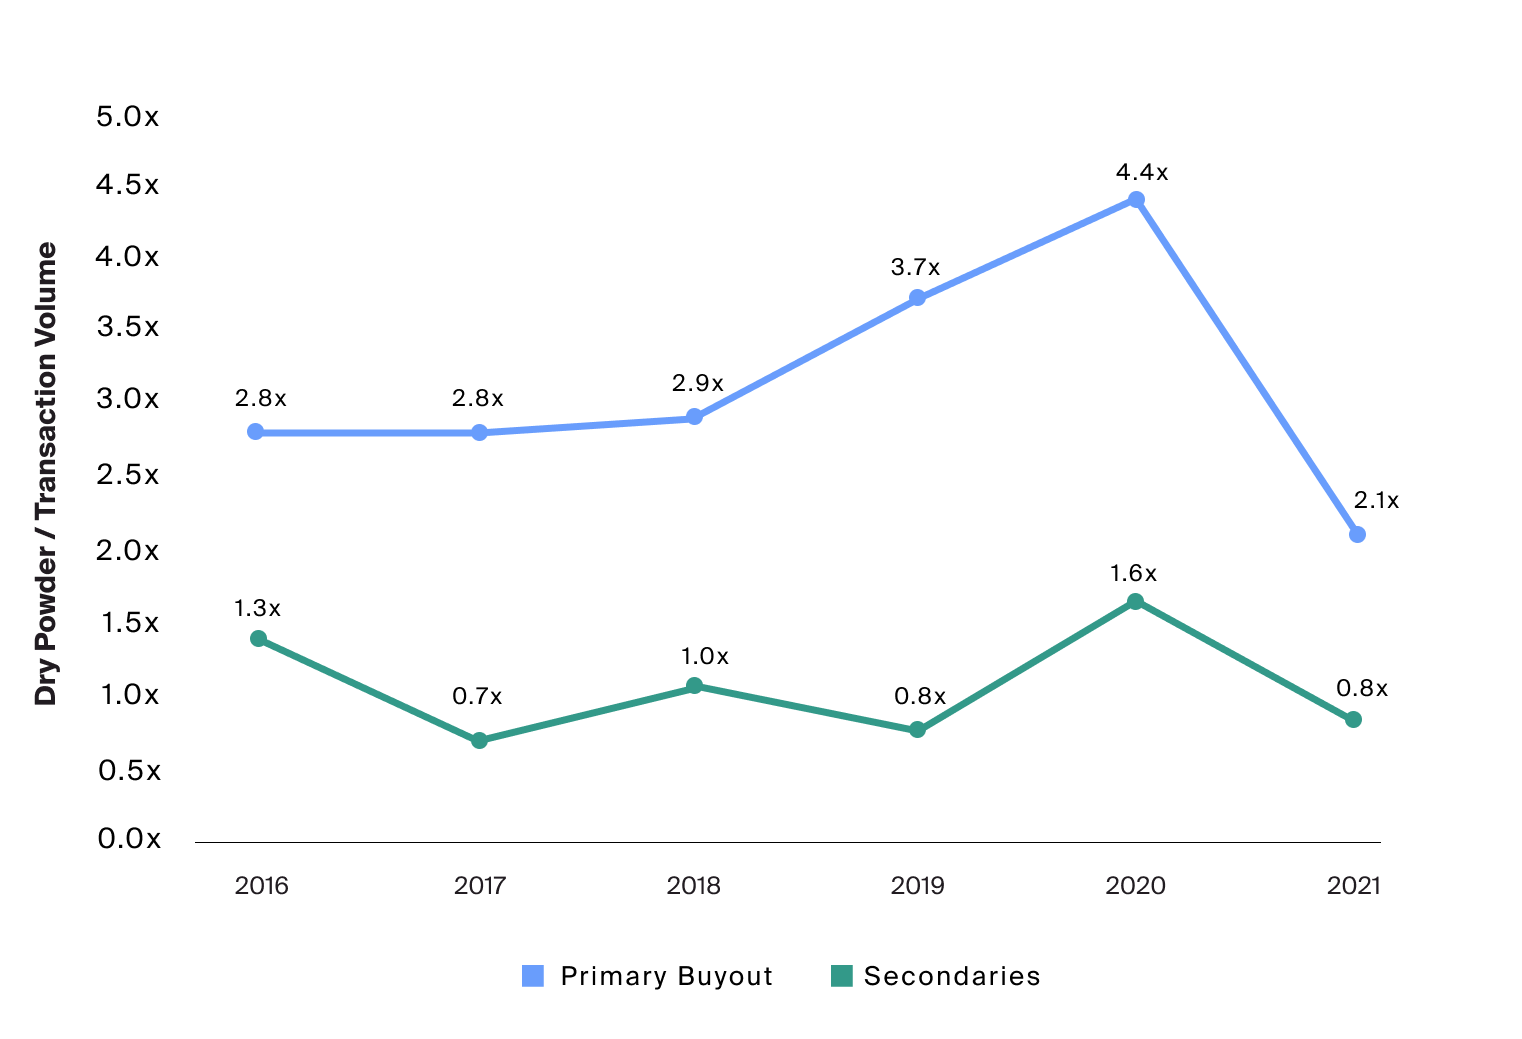
The opportunity set for secondaries, or supply side of the market, has expanded at an even greater pace, seemingly counterbalancing the influx of capital dedicated to the asset class. This balance may be measurable by considering the ratio of secondary dry powder to secondary transaction volume, which was 0.8x compared with 2.1x for buyout in 2021 (Exhibit 2).
Source: Jefferies 1H 2022 Global Secondary Market Review, July 2022; Preqin, as of 12/31/2021.
The opportunity set for secondaries, or supply side of the market, has expanded at an even greater pace, seemingly counterbalancing the influx of capital dedicated to the asset class. This balance may be measurable by considering the ratio of secondary dry powder to secondary transaction volume, which was 0.8x compared with 2.1x for buyout in 2021.
This relatively low multiple for secondaries, in comparison to its level in the year prior and to its traditional private equity counterpart, may indicate there are fewer dedicated dollars chasing any given secondary transaction. In other words, deals have perhaps not become more competitive simply due to the influx of new capital.
Source: Jefferies 1H 2022 Global Secondary Market Review, July 2022.
The relatively low multiple for secondaries, in comparison to its level in the year prior and to its traditional private equity counterpart, may indicate there are fewer dedicated dollars chasing any given secondary transaction. In other words, deals have perhaps not become more competitive simply due to the influx of new capital.
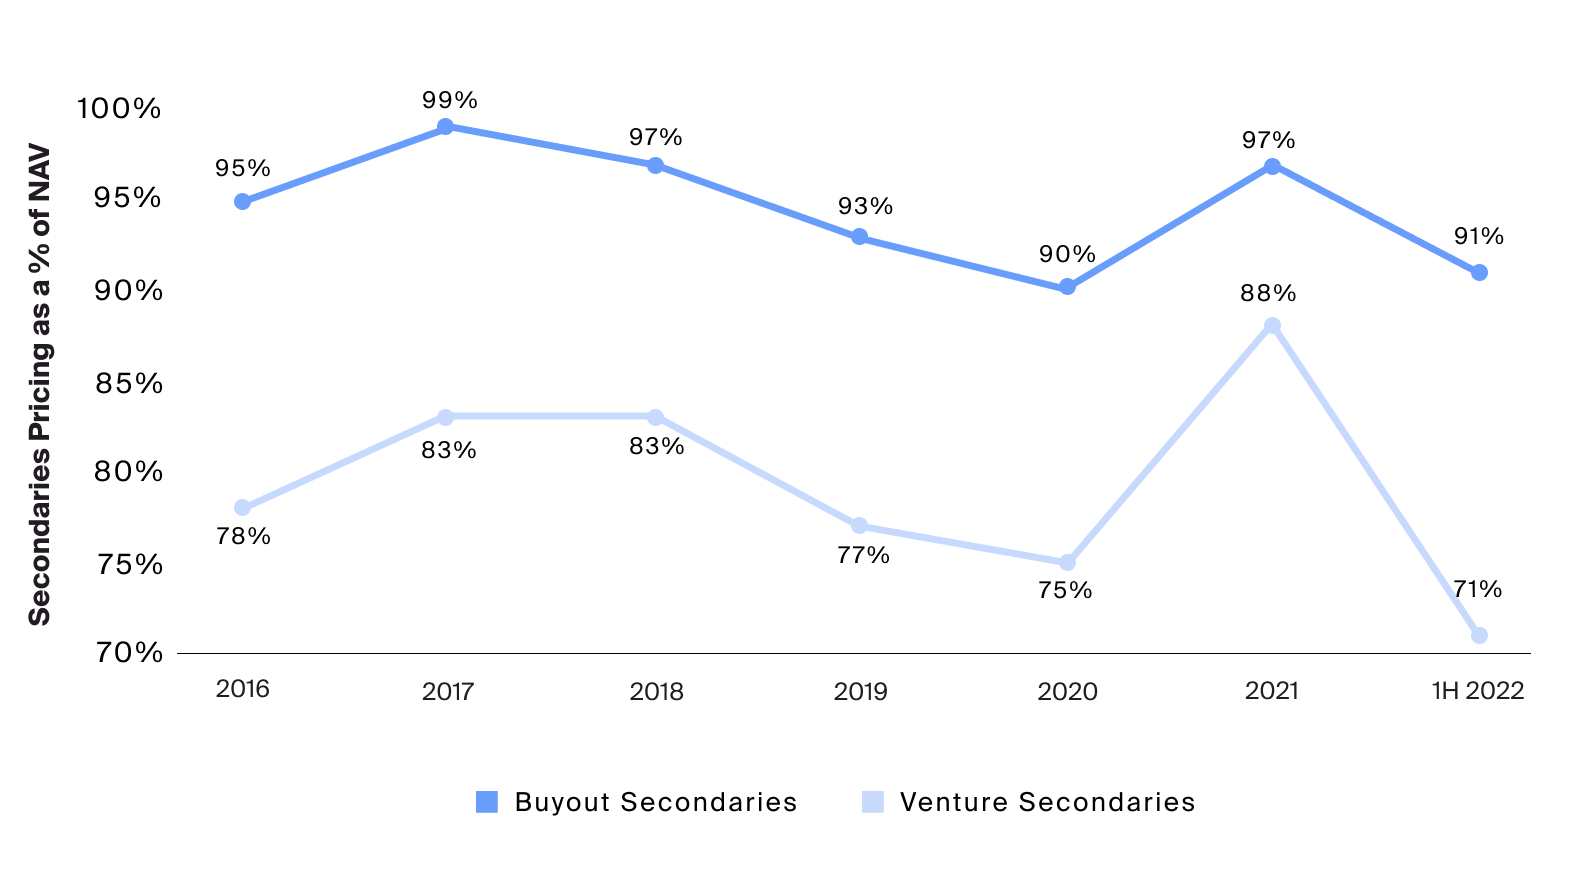
At a high level, pricing in the overall secondary market has remained at a moderate discount to par, with transactions between 2016 to the first half of 2022 pricing around 7 – 14% below last NAV (Exhibit 3). In fact, the most recent data on pricing was at the lower end of this range. These muted prices seem to reinforce the market’s relatively strong supply side, which may relieve potential pressure on discounts for the time being.
The persistent gap in discounts between buyout and venture secondaries may be attributable to the difference in uncertainty of valuation between the two types of assets. Companies in buyout tend to be mature and generate more stable returns with lower volatility,7 compared to venture companies which often are earlier stage and involve a potentially wider distribution of returns.8 As a result, secondary buyers are typically more willing to pay closer to par for buyout assets due to their higher perceived quality.
The Rise of GP-Led Secondaries
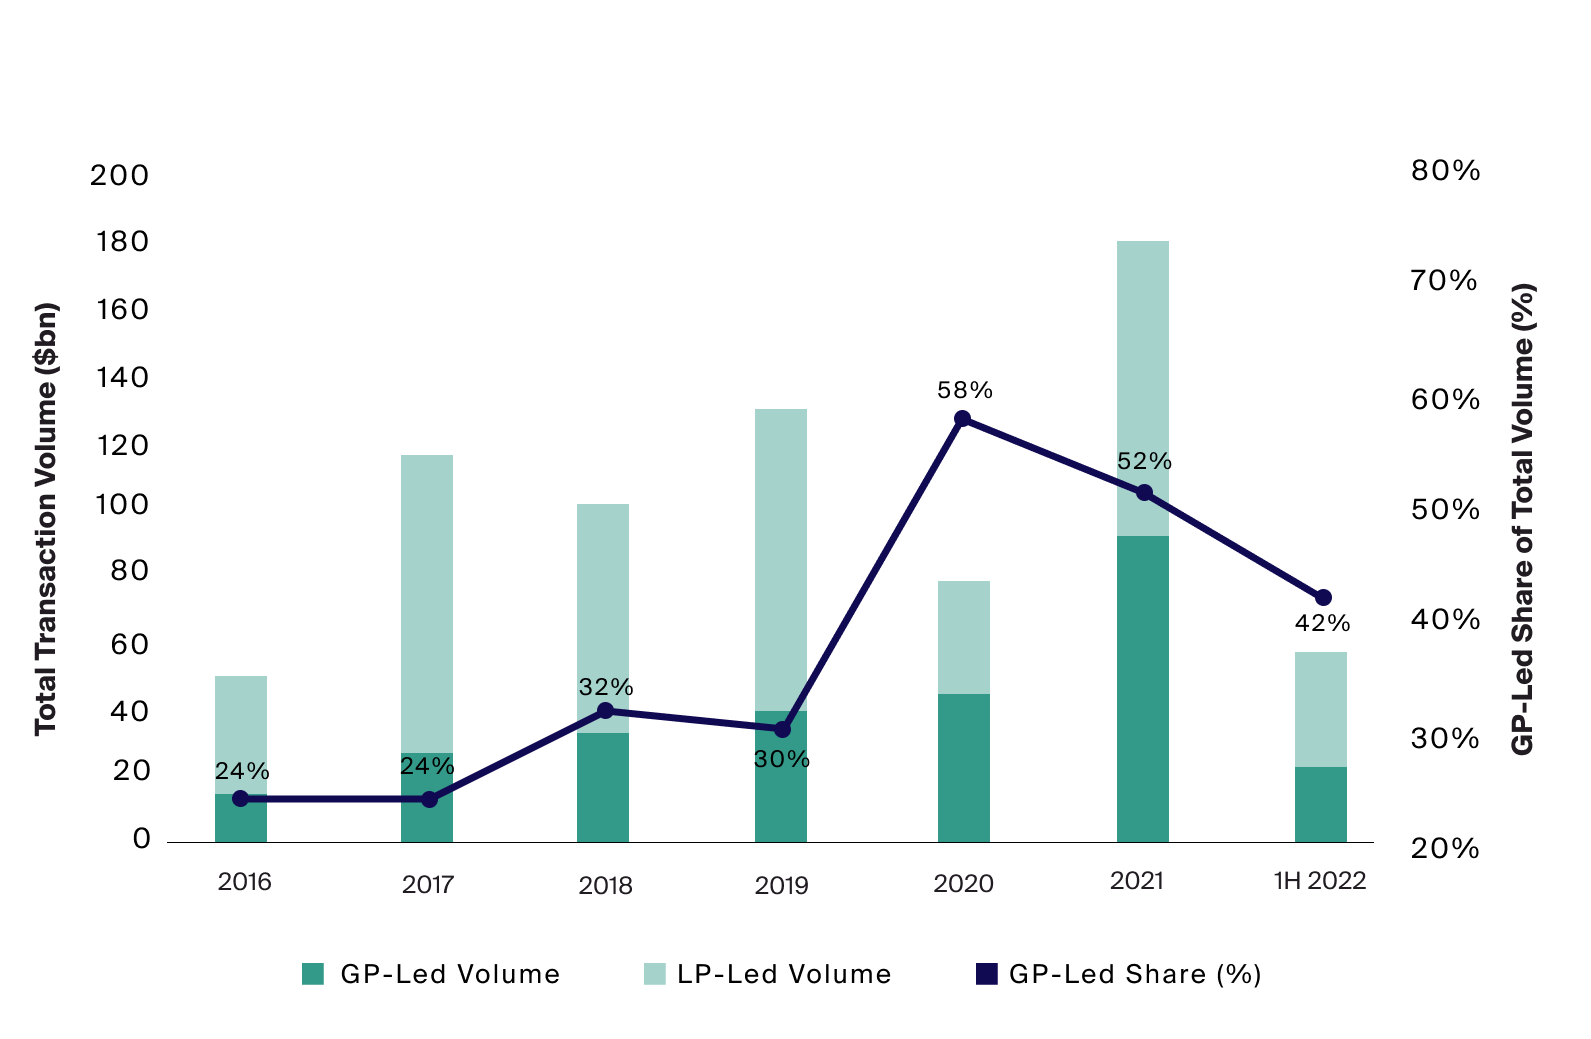
In its early days, the secondary market was mostly driven by LPs seeking early liquidity from their private equity investments; now, GP-led transactions are nearly just as common, making up approximately half of total secondary transactions (Exhibit 4). This structural change has been driven by GPs adding secondaries as part of their own liquidity and asset management toolkit,9 as many consider secondary transactions as an alternative exit path for portfolio companies. These deals may also be a source of funding for restructuring older funds into continuation vehicles, which could potentially enable GPs to hold their highest-quality assets beyond a PE fund’s traditional 10+ year lifespan. GP-led transactions may generally still be beneficial for a fund’s original LPs, giving them the potential opportunity to lock in gains on their investment, while opting in or out of future participation.
Source: Jefferies 1H 2022 Global Secondary Market Review, July 2022.
According to Preqin, AUM for secondary funds has quadrupled over the past 10 years and has grown at a compounded annual growth rate of 20.2% since 2000, outstripping the overall annual growth rate of private equity AUM at 12.9% over the same period.
Despite secondary market transactions, on average, continuing to price at a discount (Exhibit 3), the subset of GP-led transactions tends to price at or above NAV. Indeed, during the first half of 2022, nearly half of all buyers paid a price at or above NAV in most of their GP-led transactions.10 This difference is potentially due to the bias towards quality assets in these types of transactions and reluctance by GPs to accept discounts.11 As such, discounts may no longer be relied upon as a meaningful driver of returns. Instead, returns may be primarily attributable to future asset appreciation through value creation, as is the case in primary fund strategies. This trend may be reinforced by the growing prevalence of single-asset continuation funds, for which GPs handpick their highest quality assets.12
The Potential for Secondaries to Mitigate PE Risks
Even though the secondaries market is changing, the attributes related to a secondary buyer’s risk mitigation still seem to hold. Both GP-led and LP-led transactions continue to offer greater transparency and visibility into underlying portfolios, for instance. Furthermore, because a late entry point may allow investors to bypass earlier periods of negative returns traditionally associated with private equity J-curves, capital losses seem to be minimized.
Source: Preqin, net multiple taken from mature primary buyout, venture and secondaries funds with vintages in 2000 – 2017, as of each fund’s last reporting date.
Even though the secondaries market is changing, the attributes related to a secondary buyer’s risk mitigation still seem to hold. Both GP-led and LP-led transactions continue to offer greater transparency and visibility into underlying portfolios, for instance. Furthermore, because a late entry point may allow investors to bypass earlier periods of negative returns traditionally associated with private equity J-curves, capital losses seem to be minimized.
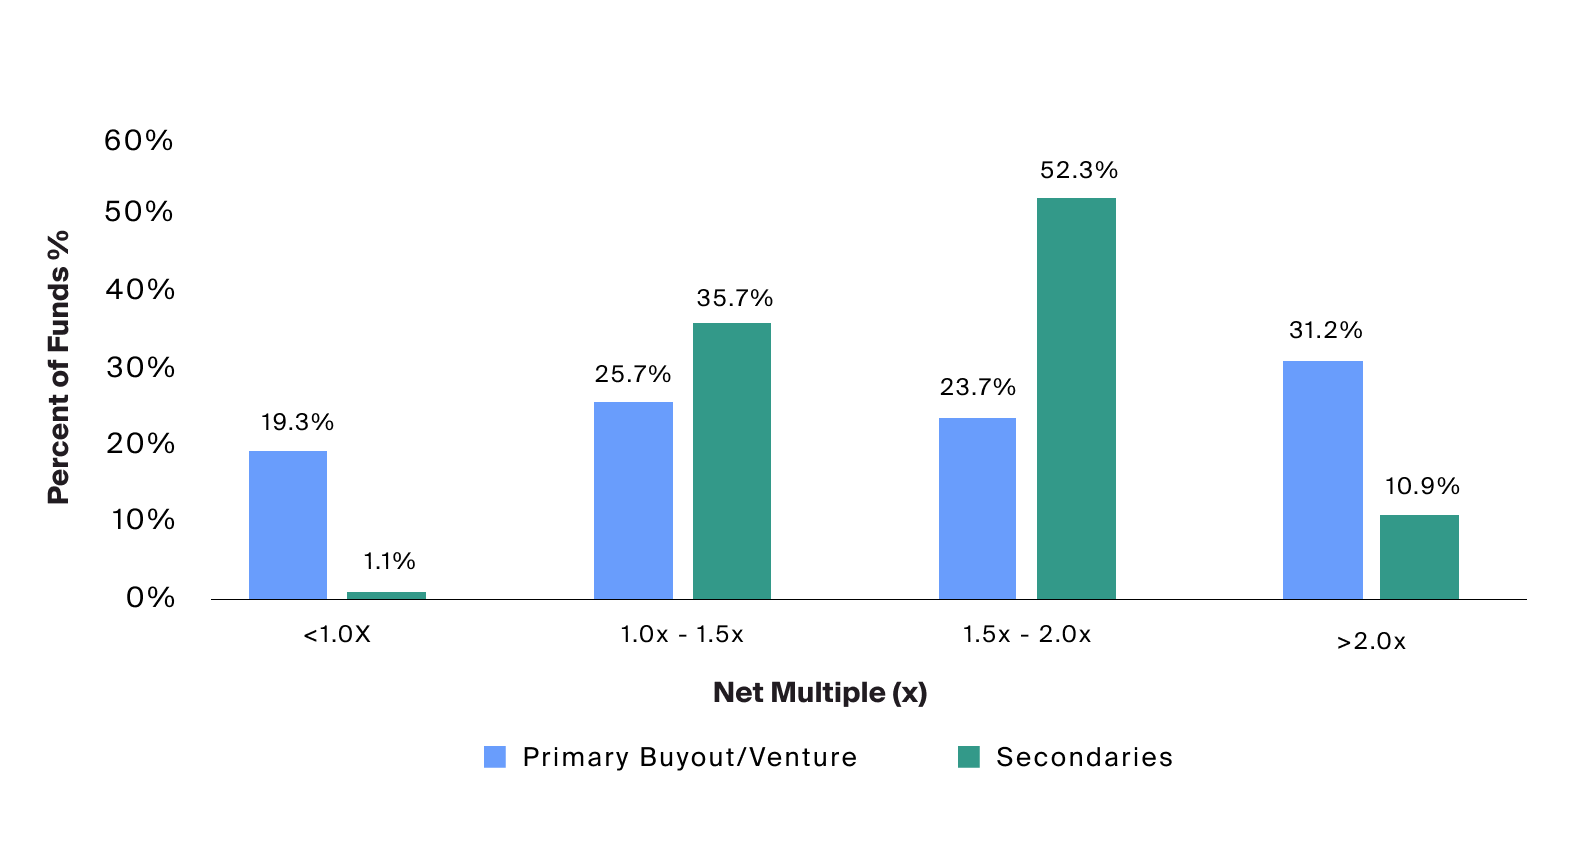
Across all mature secondary funds included in the analysis, as defined by being five or more years old, only 1.1% of funds lost capital for investors, compared to 19.3% for primary buyout and venture funds (Exhibit 5). However, the trade-off for such downside mitigation historically is that fewer secondary funds generated net multiples higher than 2.0x when compared to primary funds.
Source: Preqin, net IRR and net multiple taken from mature primary buyout, venture and secondaries funds with vintages in 2000 – 2017, as of each fund’s last reporting date.
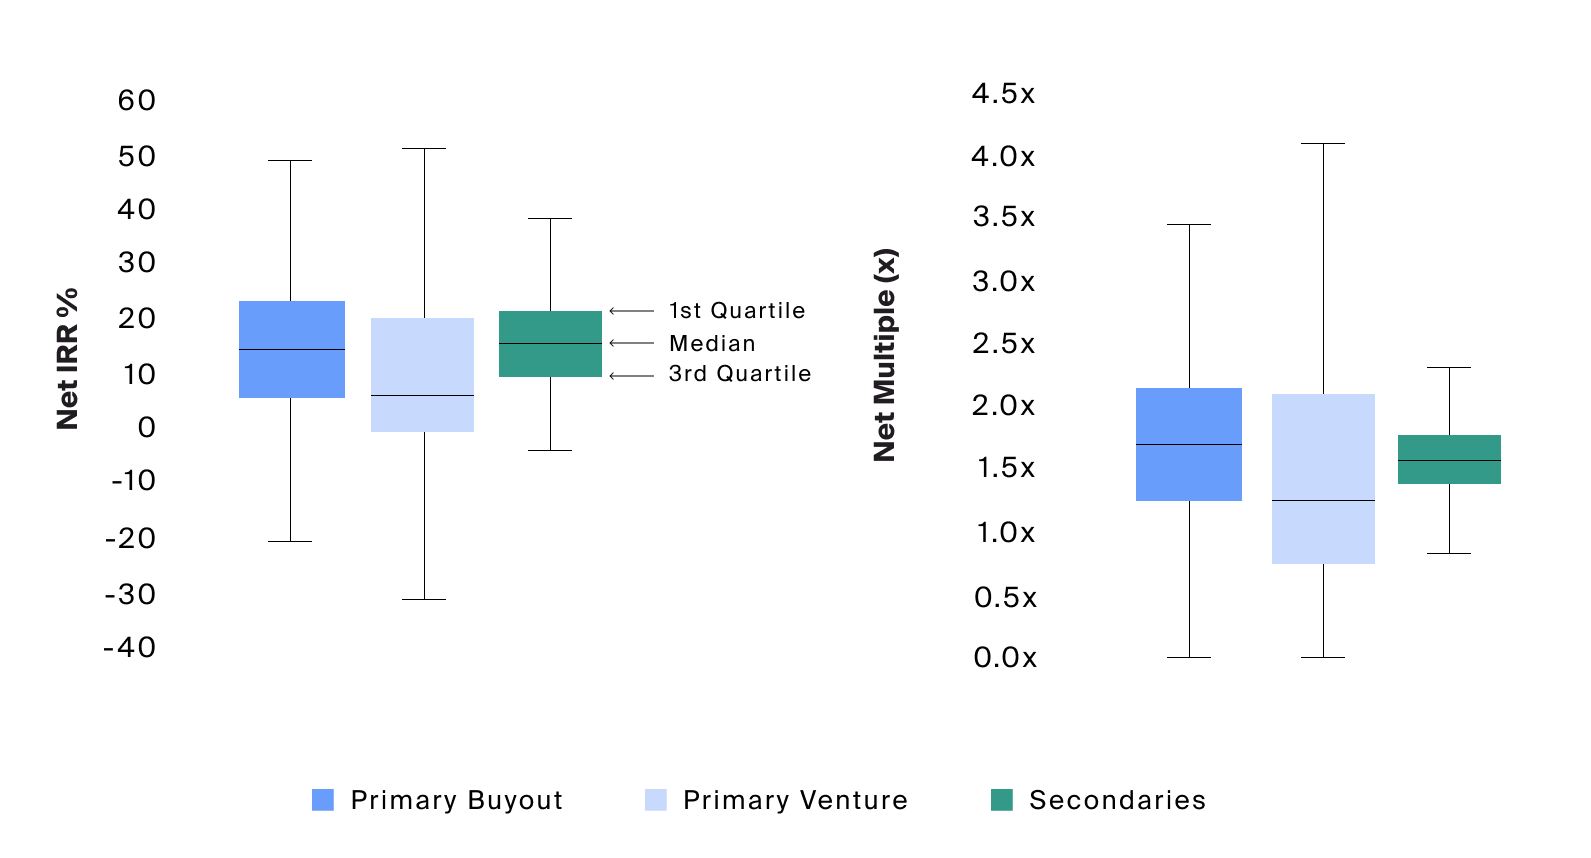
When analyzing multiples on invested capital—which eliminates the timing aspect of returns—a narrower set of outcomes for secondaries funds traded off with the potentially higher returns gained by buyout and venture capital funds.
The expected return of secondaries funds can be further quantified by looking at the dispersion of net IRR. Secondaries collectively appear to produce a higher median IRR and lower dispersion of returns when compared to primary private equity subclasses. A lower dispersion of return weighted to the upside may not only alleviate the possibility for loss but could also potentially raise the expected IRR of secondaries relative to primary PE funds. When analyzing multiples on invested capital—which eliminates the timing aspect of returns—a narrower set of outcomes for secondaries funds traded off with the potentially higher returns gained by buyout and venture capital funds (Exhibit 6).
While secondaries have some risk-mitigation advantages over investments in primary private equity funds, investors must still be mindful of the common risks related to the asset class, which we cover in our introductory article on secondaries.
Accessing the Evolving Opportunity Set
To access secondaries, investors may seek to partner with skilled secondary buyers who manage fund-of-fund vehicles with a mix of primary and secondary opportunities or who specialize in secondaries-focused funds. Indeed, the quickly evolving and idiosyncratic nature of transactions within the GP-led secondary market in particular may increasingly advantage those with deep pre-existing ties within the broader PE industry. By having such relationships and access to proprietary data, experienced buyers can take advantage of information asymmetries regarding the valuation of underlying portfolio company performance and seek to negotiate better terms.
Secondaries remain an evolving method for accessing and building diversified private equity exposure with greater liquidity across market cycles. Investors may consider the implications of these ongoing changes when building their portfolios.


