What You'll Learn
Though private infrastructure funds, in aggregate, lagged public equities for much of the period during and following the Global Financial Crisis, the magnitude of outperformance during higher-inflation quarters led the asset class to perform on par with the S&P 500 on an annualized basis during this period overall.
Since 2007, private infrastructure funds have collectively appeared to uphold their reputation as an inflation hedge—outperforming public equity, bond, and private real estate indices in quarters with above-average inflation.
Private infrastructure funds, in aggregate, have demonstrated a low correlation to public equities and fixed income, while maintaining a moderate correlation to private real estate. They also had smaller drawdowns than public equities, perhaps most significantly following the 2022 Fed rate hikes.
Amid tightening monetary policy and inflation, infrastructure has drawn increased interest for its potential to protect in market downturns, hedge against inflation, and offer potentially predictable, uncorrelated returns.1 In this new, more challenging macroeconomic environment, advisors may now be revisiting the positioning of the asset class.
As we note in our introductory piece, with attributes like long-term contracts and relatively predictable cash flows, infrastructure assets have presented potential benefits for investors. But how has private infrastructure, as an asset class, actually performed compared to more traditional asset classes, like bonds and equities, or its real-asset counterpart, private real estate?
In this piece, we analyze historical returns and risks to inform advisors about the potential benefits and risks of private infrastructure in relation to private real estate and more traditional assets in a strategic allocation, like public equities and bonds. We find that in the last 15 years, while individual funds may not have performed accordingly over time—and while performance has varied across different inflationary environments—private infrastructure in the aggregate has provided a similar total return as public equities, represented by the S&P 500. Also, at least during this period from December 2007 to March 2023, the characteristics of infrastructure assets seem to have enabled the asset class to outperform in higher inflationary environments and have provided portfolio diversification in economic downturns, given its low correlation to traditional asset classes.
How Does Private Infrastructure Compare to Other Asset Classes?
Our analysis uses the Preqin Infrastructure Index, which shows the quarterly change in the returns on invested capital for all private market infrastructure funds that Preqin tracks, from the index’s inception in December 2007 to March 2023.2 To enable a closer comparison with indices that report at a more regular frequency (i.e. daily for the S&P 500), our analysis focuses only on quarterly returns, normalizing the data and potentially alleviating the issue of “artificially” lower volatility of a less frequently updated index.
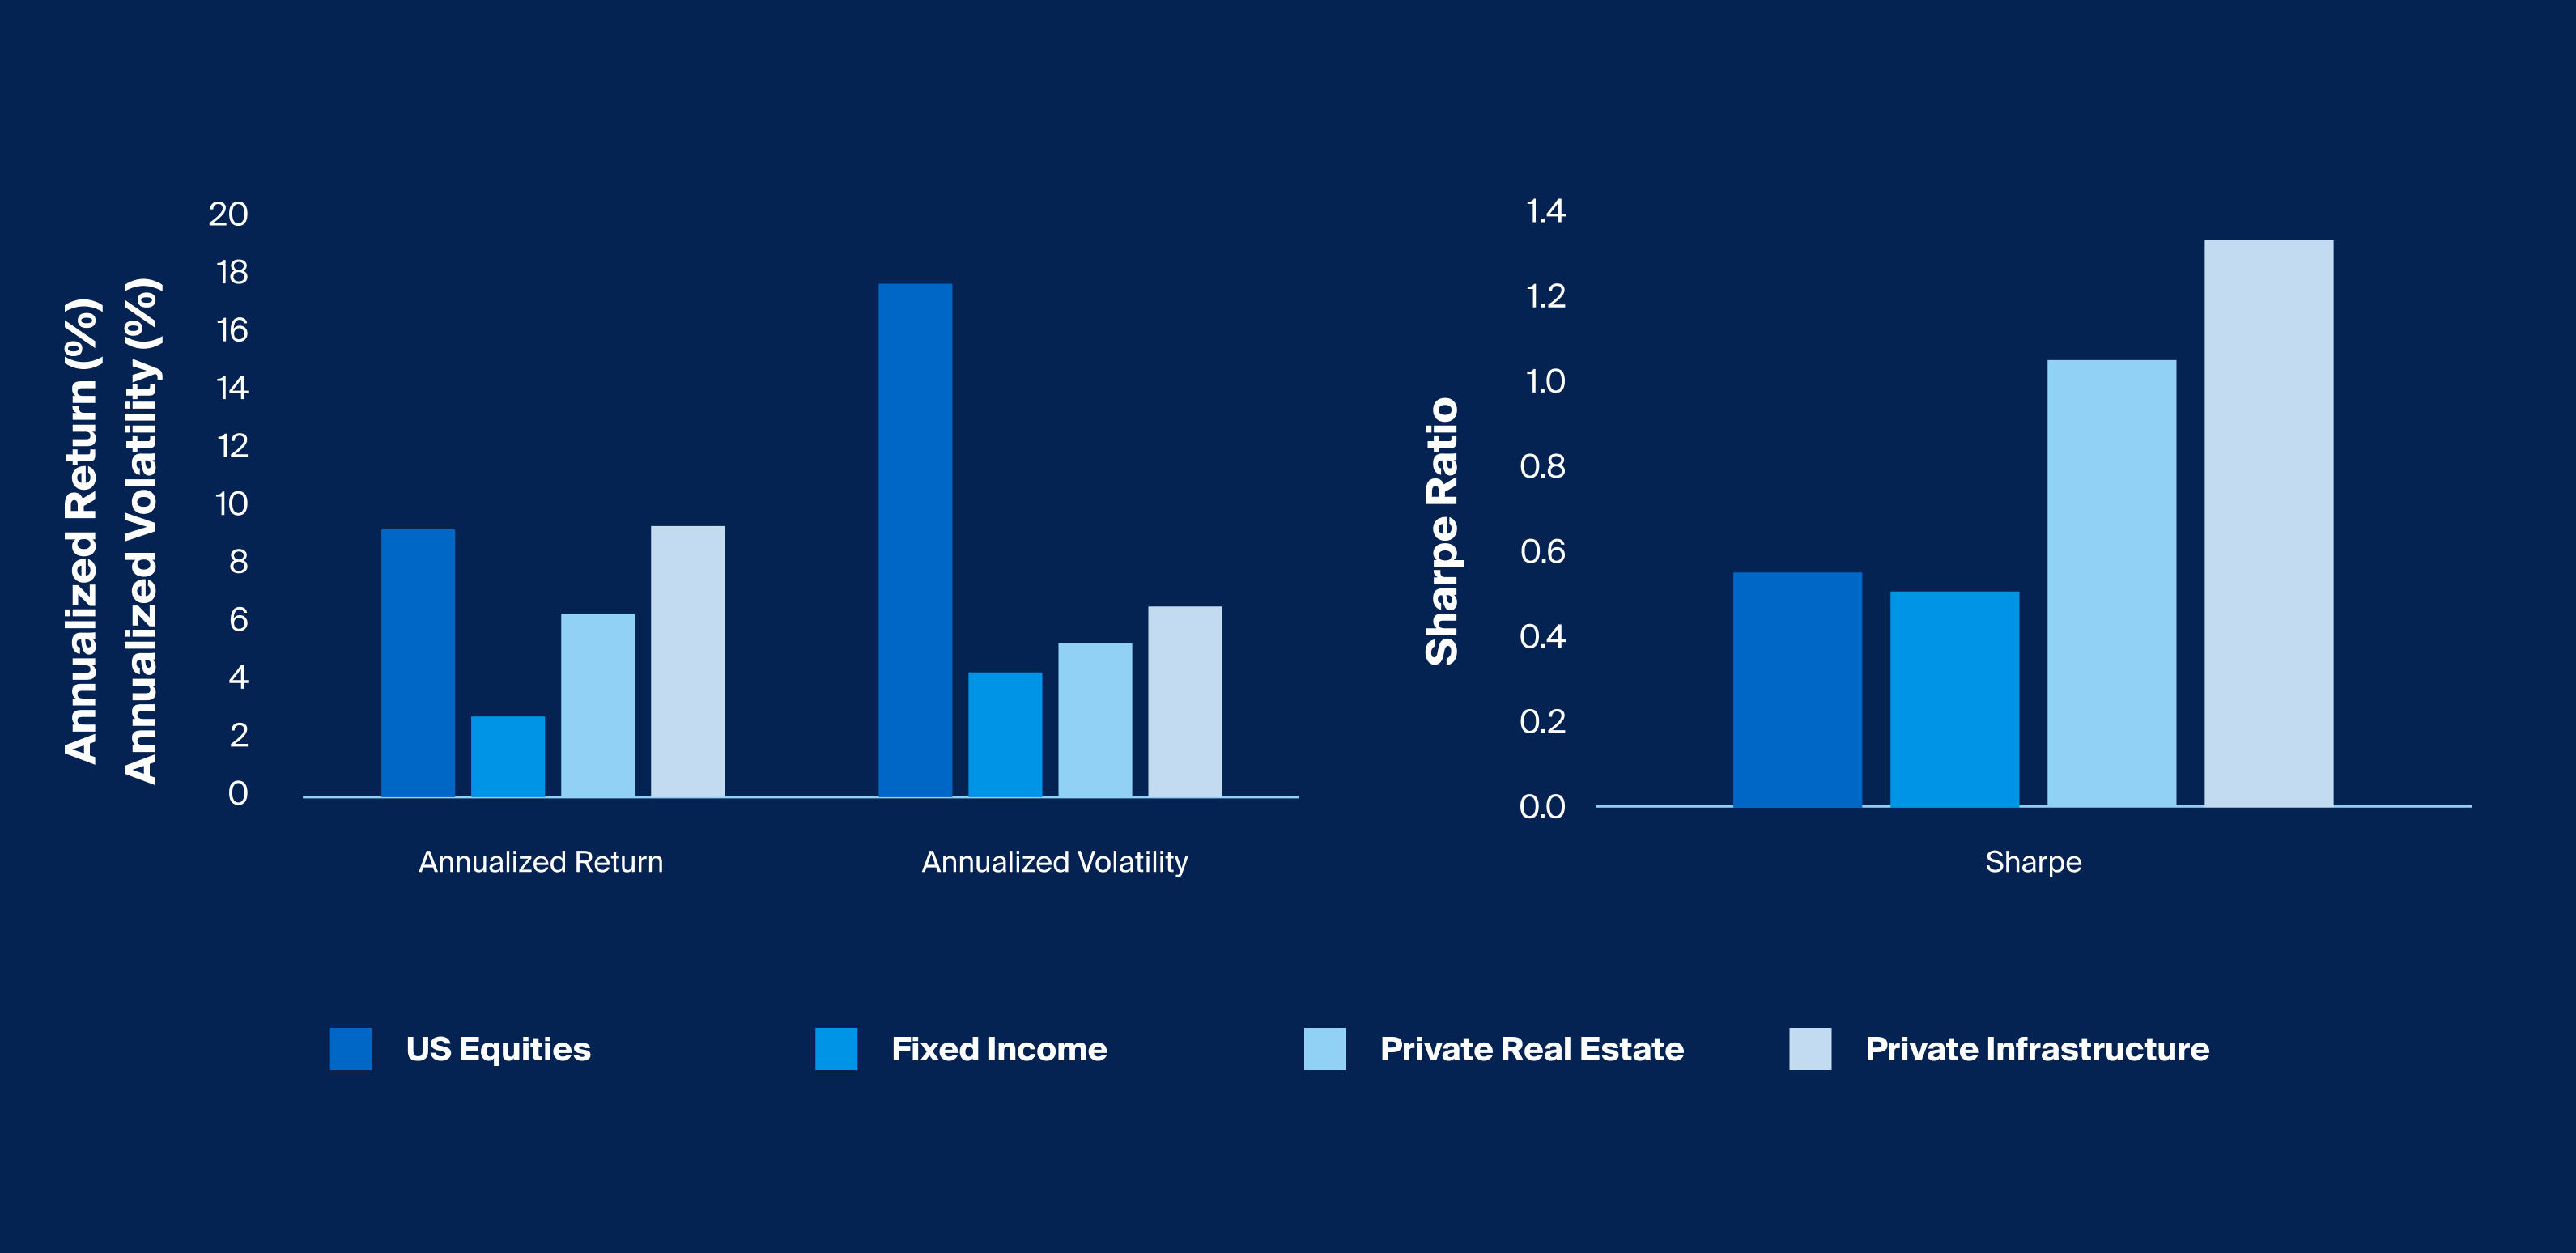
Since inception in December 2007, the Preqin Infrastructure Index has delivered a 9.3% annualized return, narrowly outperforming public equities (as represented by the S&P 500) by 0.1% in the same period (Exhibit 1). Importantly, even when controlling for the difference in reporting, the index also had a lower annualized volatility of 5.3%, compared to 17.6% for the S&P 500. The risk-adjusted return statistic for private infrastructure is also higher at 1.05, exceeding that of public equities, bonds (as represented by the Bloomberg Barclays US Aggregate Bond Index), and private real estate (as represented by the NCREIF Private Real Estate Index).

Footnotes
Source: Bloomberg, Venn, US Equities represented by S&P 500 Total Return Index, Fixed Income represented by Bloomberg Barclays US Aggregate Bond Index, Private Real Estate represented by the NCREIF Property Index, Preqin, Private Infrastructure represented by the Preqin Infrastructure Index, December 2007 to March 2023. Past performance is no guarantee of future results.
Source: Bloomberg, Venn, US Equities represented by S&P 500 Total Return Index, Fixed Income represented by Bloomberg Barclays US Aggregate Bond Index, Private Real Estate represented by the NCREIF Property Index, Preqin, Private Infrastructure represented by the Preqin Infrastructure Index, December 2007 to March 2023. Past performance is no guarantee of future results.
Infrastructure assets are typically known for sustaining monopolistic pricing power and delivering essential services with long-term contracts, allowing investments to be less sensitive to market cycles. With valuations partially derived from the performance of the underlying assets, private infrastructure funds are thus not subject to the volatility of public market pricing and may have more stable intrinsic value.3
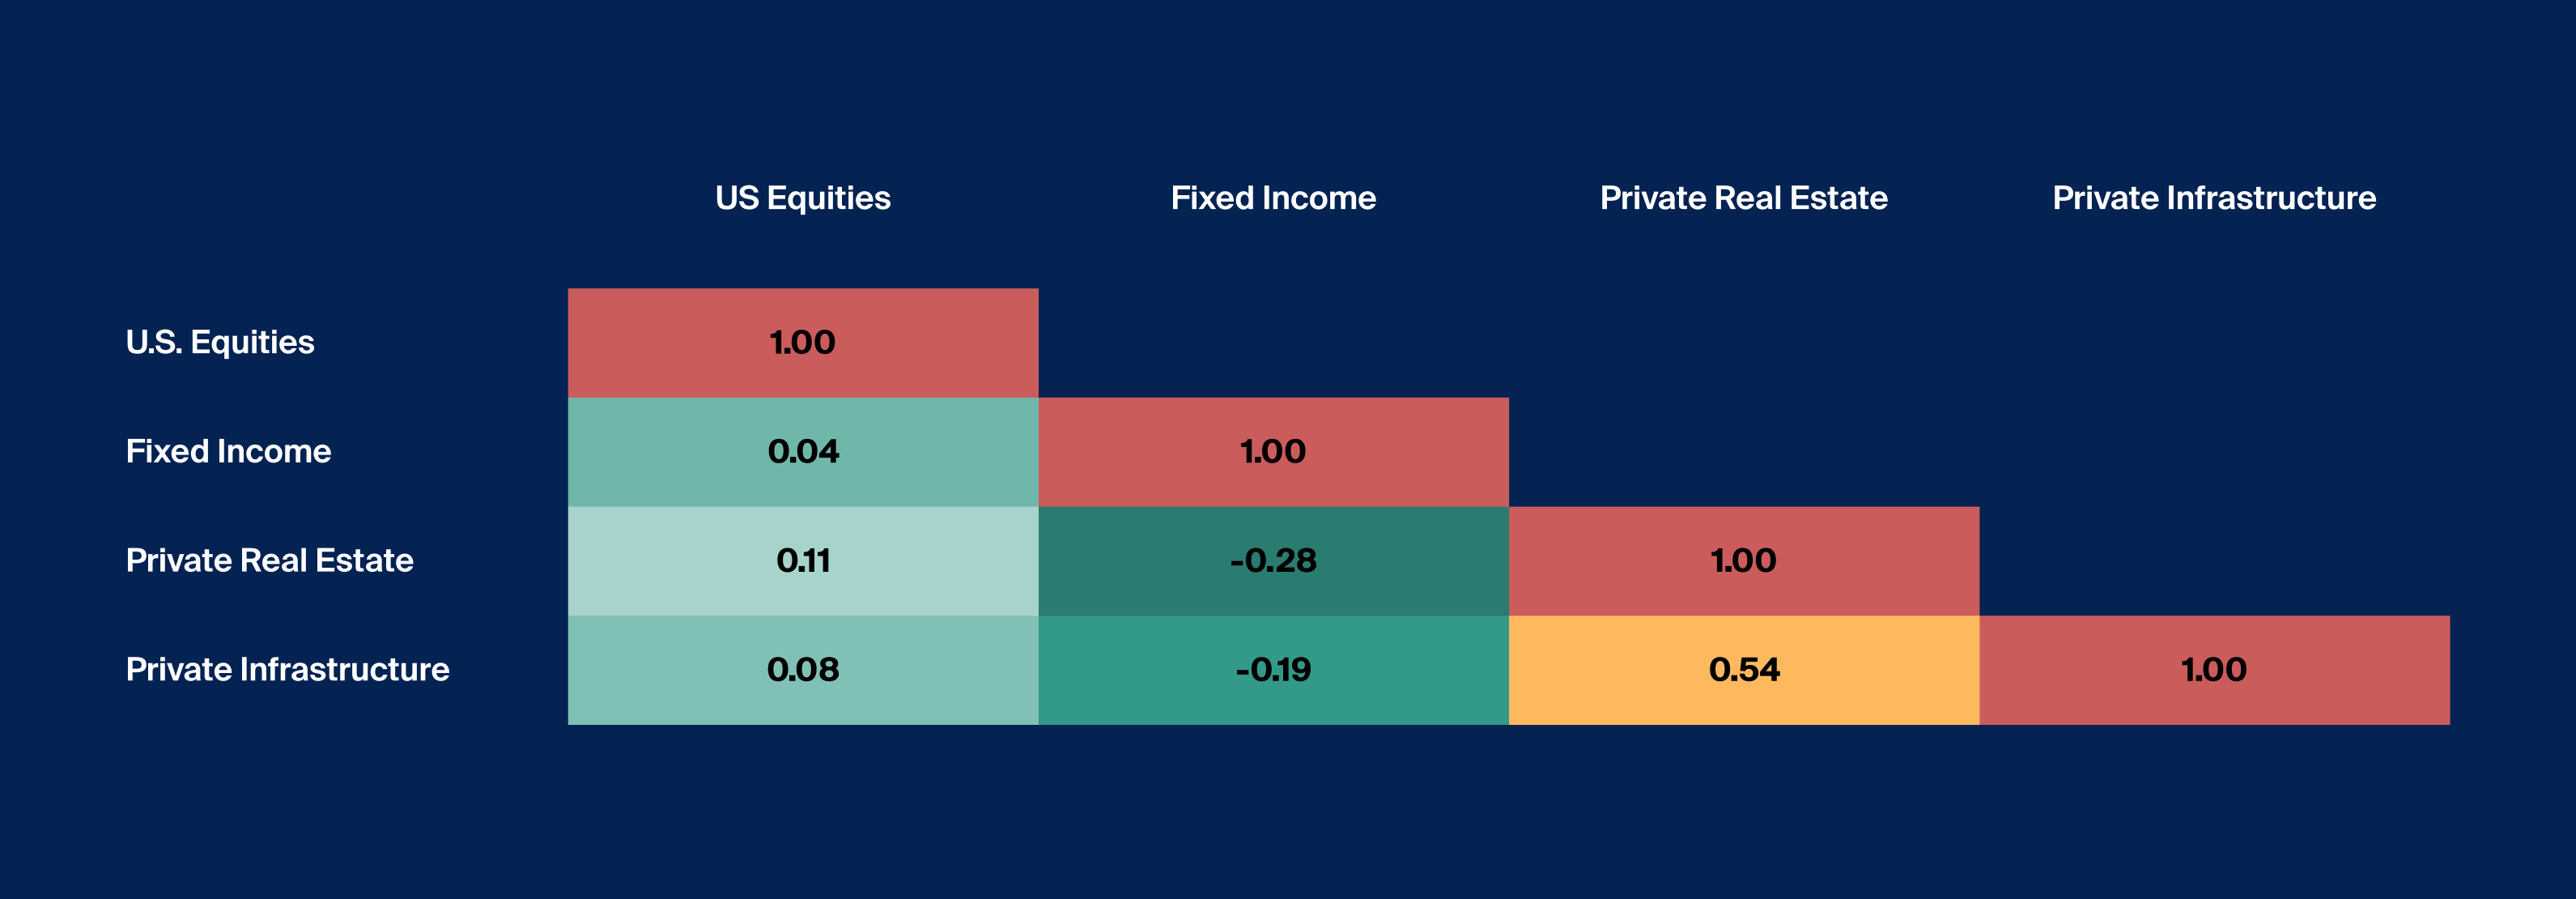
Given its unique return drivers, advisors may also find that private infrastructure may provide an opportunity for potential diversification. The asset class has demonstrated a low correlation historically to both public equities and fixed income (0.12 and -0.21, respectively), while also maintaining a moderate correlation (0.55) to private real estate (Exhibit 2). This diversifying characteristic may be increasingly important as the relationship between fixed income and public equity returns has been called into question and real estate valuations struggle to find their footing in a higher-rate environment.4

Footnotes
Source: Bloomberg, US Equities represented by S&P 500 Total Return Index, Fixed Income represented by Bloomberg Barclays US Aggregate Bond Index, Private Real Estate represented by the NCREIF Property Index, Preqin, Private Infrastructure represented by the Preqin Infrastructure Index, December 2007 to March 2023.
Source: Bloomberg, US Equities represented by S&P 500 Total Return Index, Fixed Income represented by Bloomberg Barclays US Aggregate Bond Index, Private Real Estate represented by the NCREIF Property Index, Preqin, Private Infrastructure represented by the Preqin Infrastructure Index, December 2007 to March 2023.
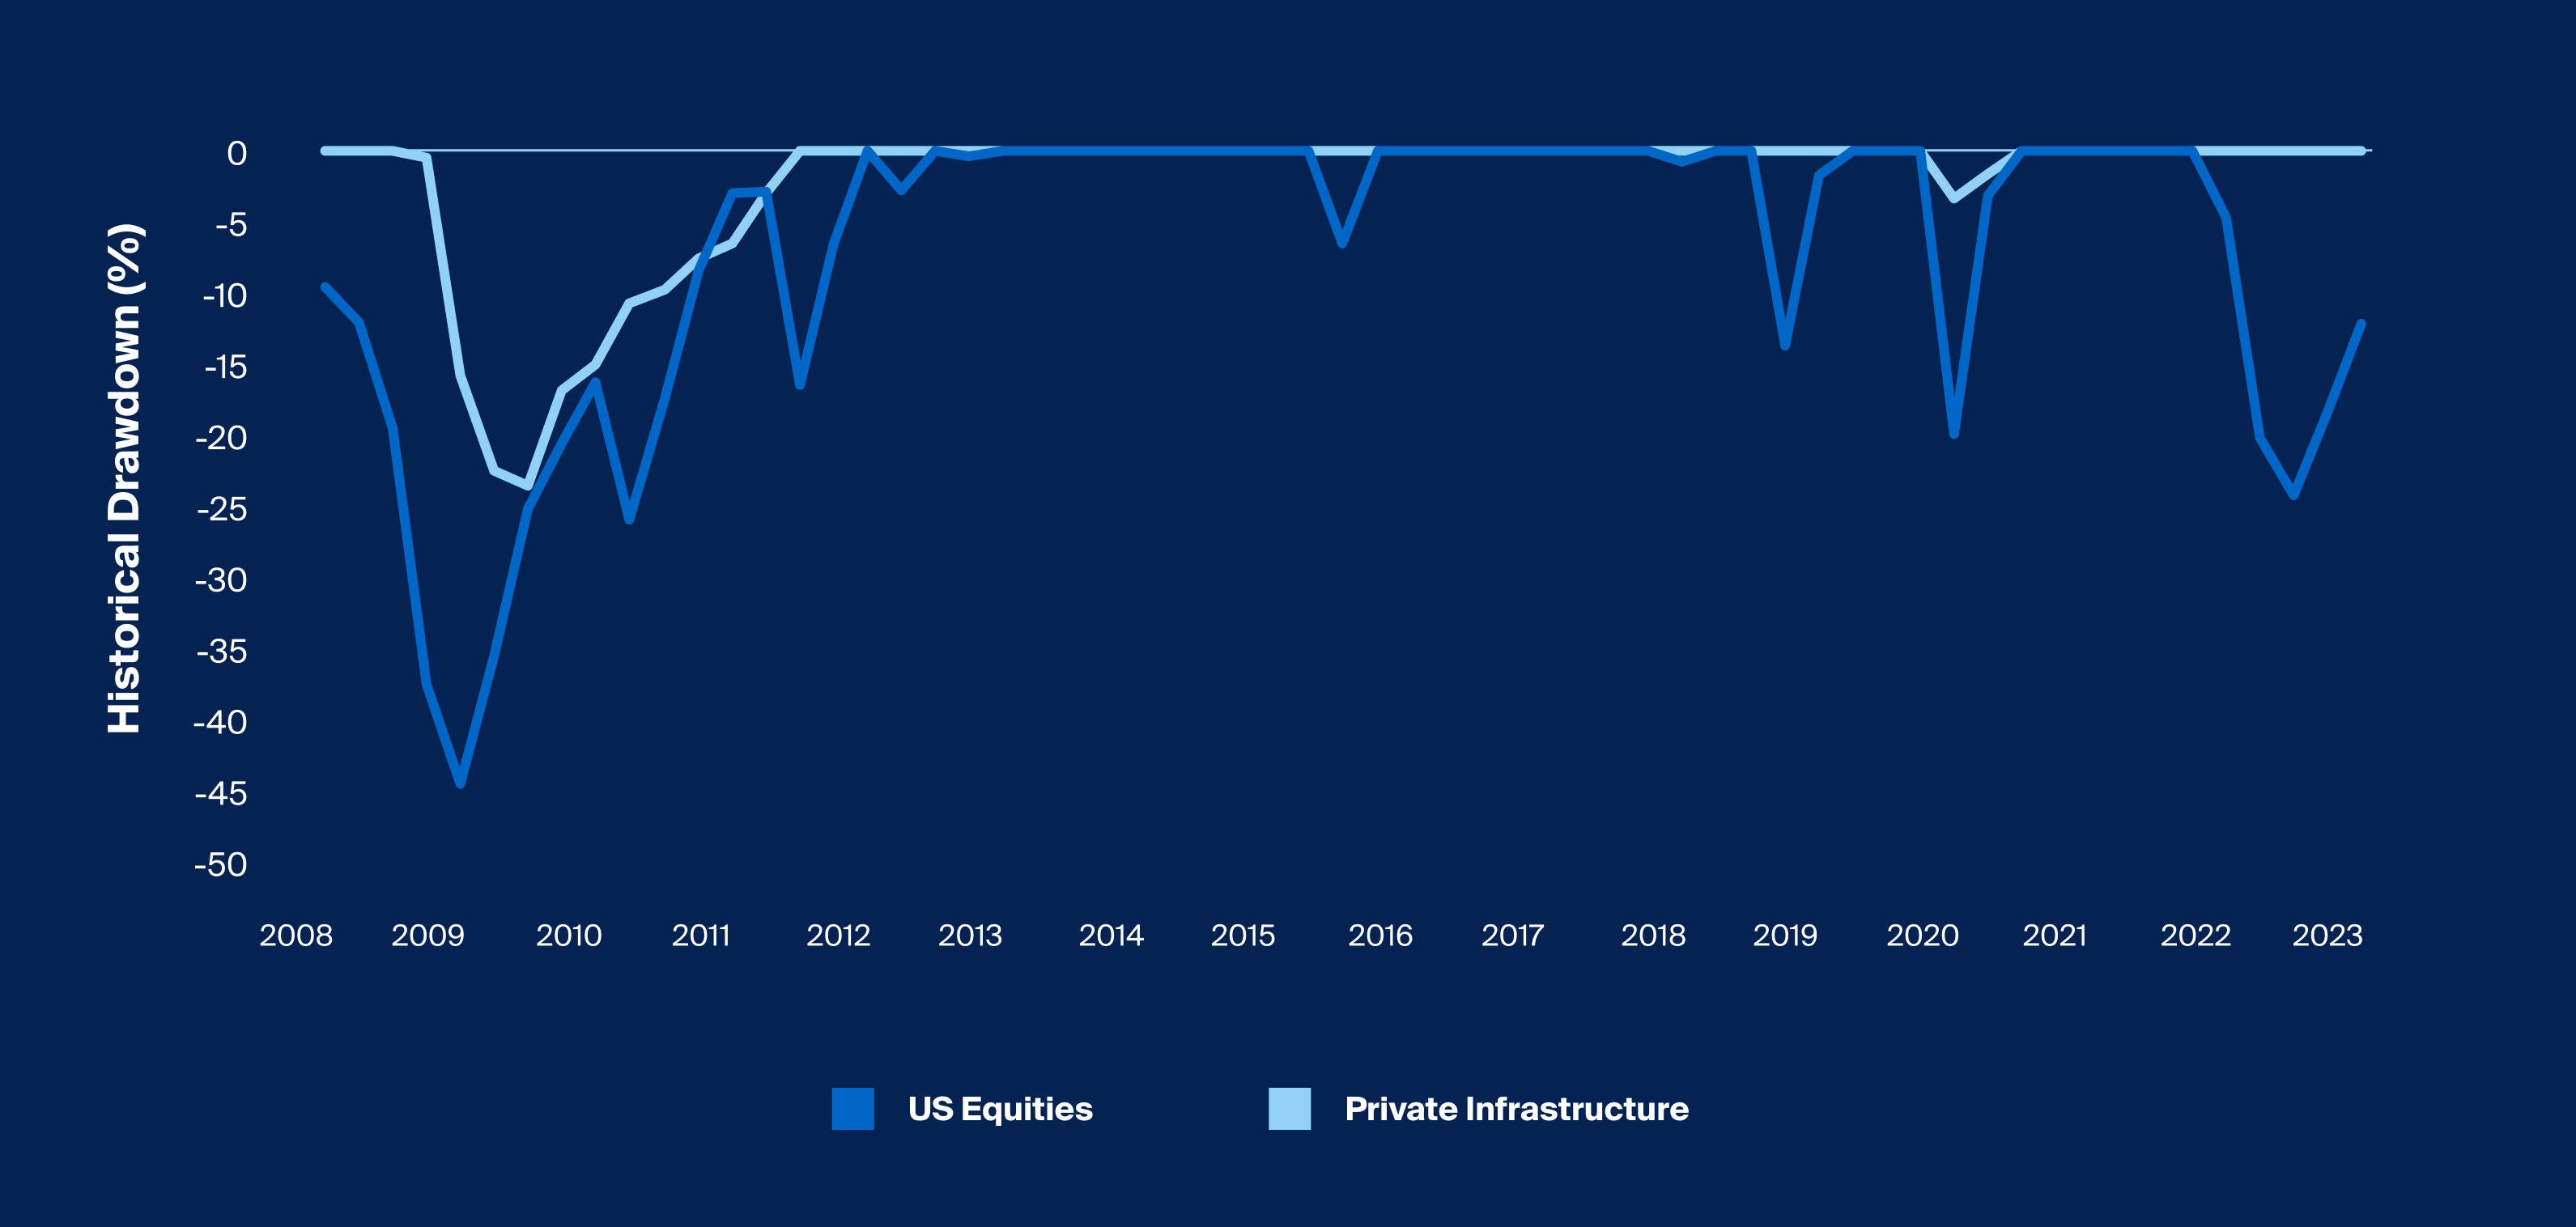
Private infrastructure’s historic drawdown, a measure of downside volatility, has been lower relative to public equities in previous market downturns. During the Global Financial Crisis (GFC), private infrastructure only drew down 23.2%, compared to the S&P 500, which suffered a maximum drawdown of 43.9% two quarters prior (Exhibit 3). The same is true of the public market selloff that followed the Fed rate hikes in 2022. While the S&P 500 experienced a drawdown of roughly 24%, private infrastructure hardly budged.

Footnotes
Source: Bloomberg, Venn, US Equities represented by S&P 500 Total Return Index, Preqin, Private Infrastructure represented by the Preqin Infrastructure Index, December 2007 to March 2023. Past performance is no guarantee of future results.
Source: Bloomberg, Venn, US Equities represented by S&P 500 Total Return Index, Preqin, Private Infrastructure represented by the Preqin Infrastructure Index, December 2007 to March 2023. Past performance is no guarantee of future results.
Historically, the essential nature and long life of infrastructure assets, along with long-term contracts and monopolistic pricing, seemed to make private infrastructure funds less susceptible to economic cycles. All these elements may support growth-oriented cash flows, particularly for core or core-plus infrastructure assets.
In addition, cash distributions for these types of assets can provide a significant part of the total return generated.5 Stable income returns have contributed to infrastructure’s consistent total returns. In fact, return dispersion for private infrastructure has been comparable to that of fixed income over the last 20 years and less than half that for public equities.6
How Has Infrastructure Performed Historically in Similar Market Environments?
So why have investors underallocated to private infrastructure?7 Besides being a relatively newer asset class—even compared to other alternatives—8 the experience that investors would have had with individual private infrastructure funds generally would not have measured up to the nominal returns of passive public equity strategies during much of the period following the GFC.
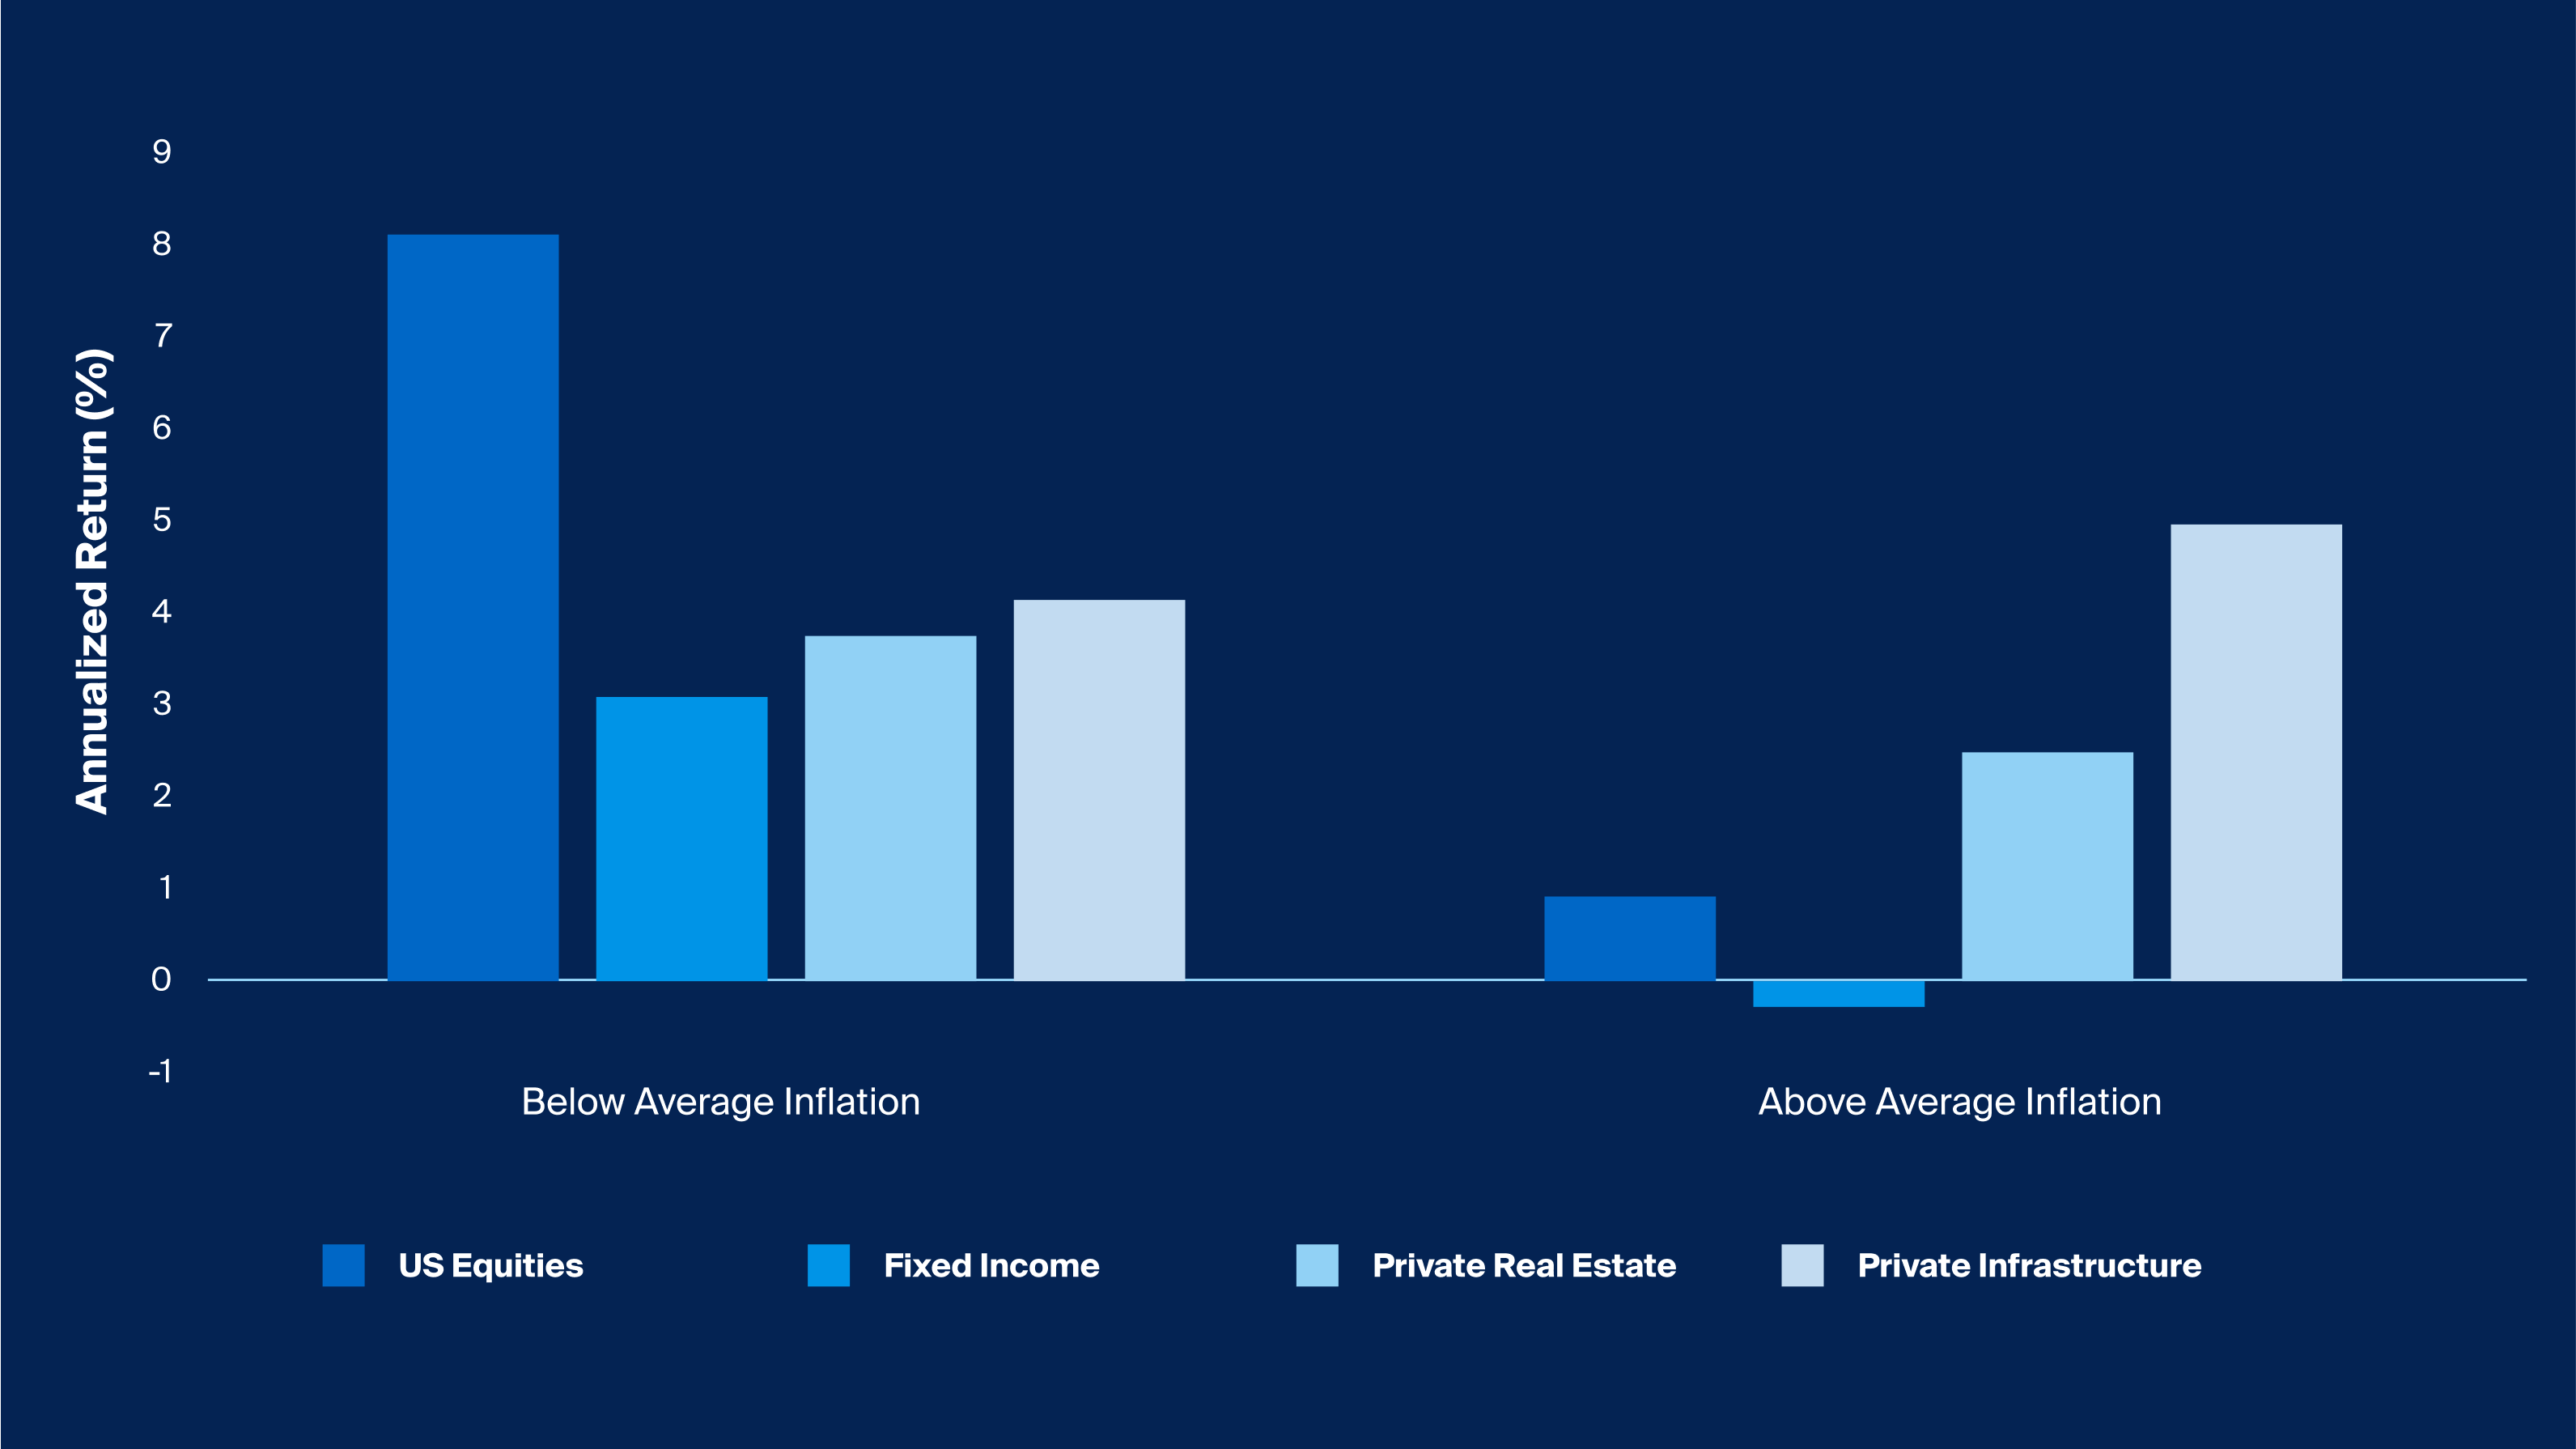
Between December 2007 and March 2023, the YoY inflation rate (as measured by CPI) averaged 2.41%.9 Across the 42 non-consecutive quarters that the inflation rate fell below this average, the Preqin Infrastructure Index meaningfully underperformed public equities, generating an annualized return of 4.1% compared to 8.2% for the S&P 500 (Exhibit 4).
But in the 19 quarters during this period when inflation exceeded the average, private infrastructure fund performance in aggregate was higher, returning 5% on average on an annualized basis. Higher-inflation quarters appeared to have the opposite effect on the other asset classes—most dramatically for the S&P 500, which only delivered a 0.9% annualized return across those quarters. The magnitude of this outperformance during these higher-inflation quarters was so significant, in fact, that when calculating total return for the period overall, private infrastructure funds in aggregate even surpassed public equities by a small margin, as mentioned above.
It’s important to note that investing in this way—both in an index like the Preqin Infrastructure Index and during non-consecutive quarters—is impossible, so even advisors with private infrastructure allocations during this period would have had a different overall experience. Yet, even so, according to this analysis, this relatively unique difference in returns seems to support the case for infrastructure as an inflation hedge and reflects the explicit and implicit linkages that infrastructure assets have with inflation, as opposed to other asset classes.10

Footnotes
Source: Bloomberg, Venn, Inflation represented by the CPI YOY Index with average calculated over the observation period of December 2007 to March 2023, US Equities represented by S&P 500 Total Return Index, Fixed Income represented by Bloomberg Barclays US Aggregate Bond Index, Private Real Estate represented by the NCREIF Property Index, Preqin, Private Infrastructure represented by the Preqin Infrastructure Index, December 2007 to March 2023. Past performance is no guarantee of future results.
Source: Bloomberg, Venn, Inflation represented by the CPI YOY Index with average calculated over the observation period of December 2007 to March 2023, US Equities represented by S&P 500 Total Return Index, Fixed Income represented by Bloomberg Barclays US Aggregate Bond Index, Private Real Estate represented by the NCREIF Property Index, Preqin, Private Infrastructure represented by the Preqin Infrastructure Index, December 2007 to March 2023. Past performance is no guarantee of future results.
We see this explicit linkage for assets related to power generation, for example. In these cases, concessionary agreements, regulatory frameworks, and mechanisms built into long-term contracts can automatically adjust prices as inflation rises. Implicit inflation protection also exists for many infrastructure assets, even without direct contract mechanisms or regulatory links. For instance, even if regulators don't mandate inflation adjustments, they have historically allowed utilities to earn more during high inflation times through periodic rate adjustments to cover rising costs.11
Understanding Risks and Other Considerations
Our analysis of private infrastructure was based on an index that encompasses a diverse range of strategies across the risk and return spectrum. As such, it is important to understand the differences between core, core-plus, value-add, and opportunistic strategies, as well as the differences among sectors in this heterogenous and evolving asset class.12 13
Manager selection is another important consideration, as we noted in our previous analysis, given the relatively wide dispersion of returns across private infrastructure funds compared to funds that invest in traditional asset classes.
Depending on the type of asset, private infrastructure investments may also carry other key investment risks, including those related to liquidity, environmental risks, regulatory risks, or operational risks.


