What You'll Learn
Secondary volume rebounded in the second half of 2023, bringing the year as a whole back in line with the market’s rapid historical volume growth trajectory as pricing across secondary transactions generally improved
While capital raising in secondaries reached a new peak, the ratio of dry powder to transaction volume suggests continued undercapitalization, seeming to favor secondary buyers
Motivation for LPs to sell in the secondary market has shifted from the denominator effect to liquidity needs due to lower than expected distributions from legacy funds
GPs continue to leverage the secondary market to both generate liquidity for LPs as well as retain assets that they view have additional upside potential
Market participants expect a robust year for secondary market volume given greater valuation certainty and a continued dearth of traditional exit activity
The previous year has posed numerous challenges for asset managers and investors seeking to manage through a period of illiquidity.1
However, adversity can often breed innovation, leading to the development and adoption of tools designed to help ease portfolio pressures. Adoption of the secondary market as part of the portfolio management toolkit for both LPs and GPs has emerged as a viable alternative, source of liquidity, seeking to offer competitive returns.
Since our update last year, the pressures that catalyzed different segments of the secondary market have evolved, as sentiment around the broader macroeconomic environment has shifted to a more optimistic tenor.
In this piece, we’ll dive into the current state of the secondary market, the different catalysts for secondary transactions, and where opportunities may lie in the year ahead.
Secondary Transaction Volume Not Only Rebounded, but Continued Its Growth
A significant marker of the secondary market's robust growth has been the rebound in transaction volumes in the latter half of 2023, a indicator of the market's maturity and the demand for liquidity overcoming valuation concerns that held volume below expectations despite catalysts for sellers in the first half of the year.
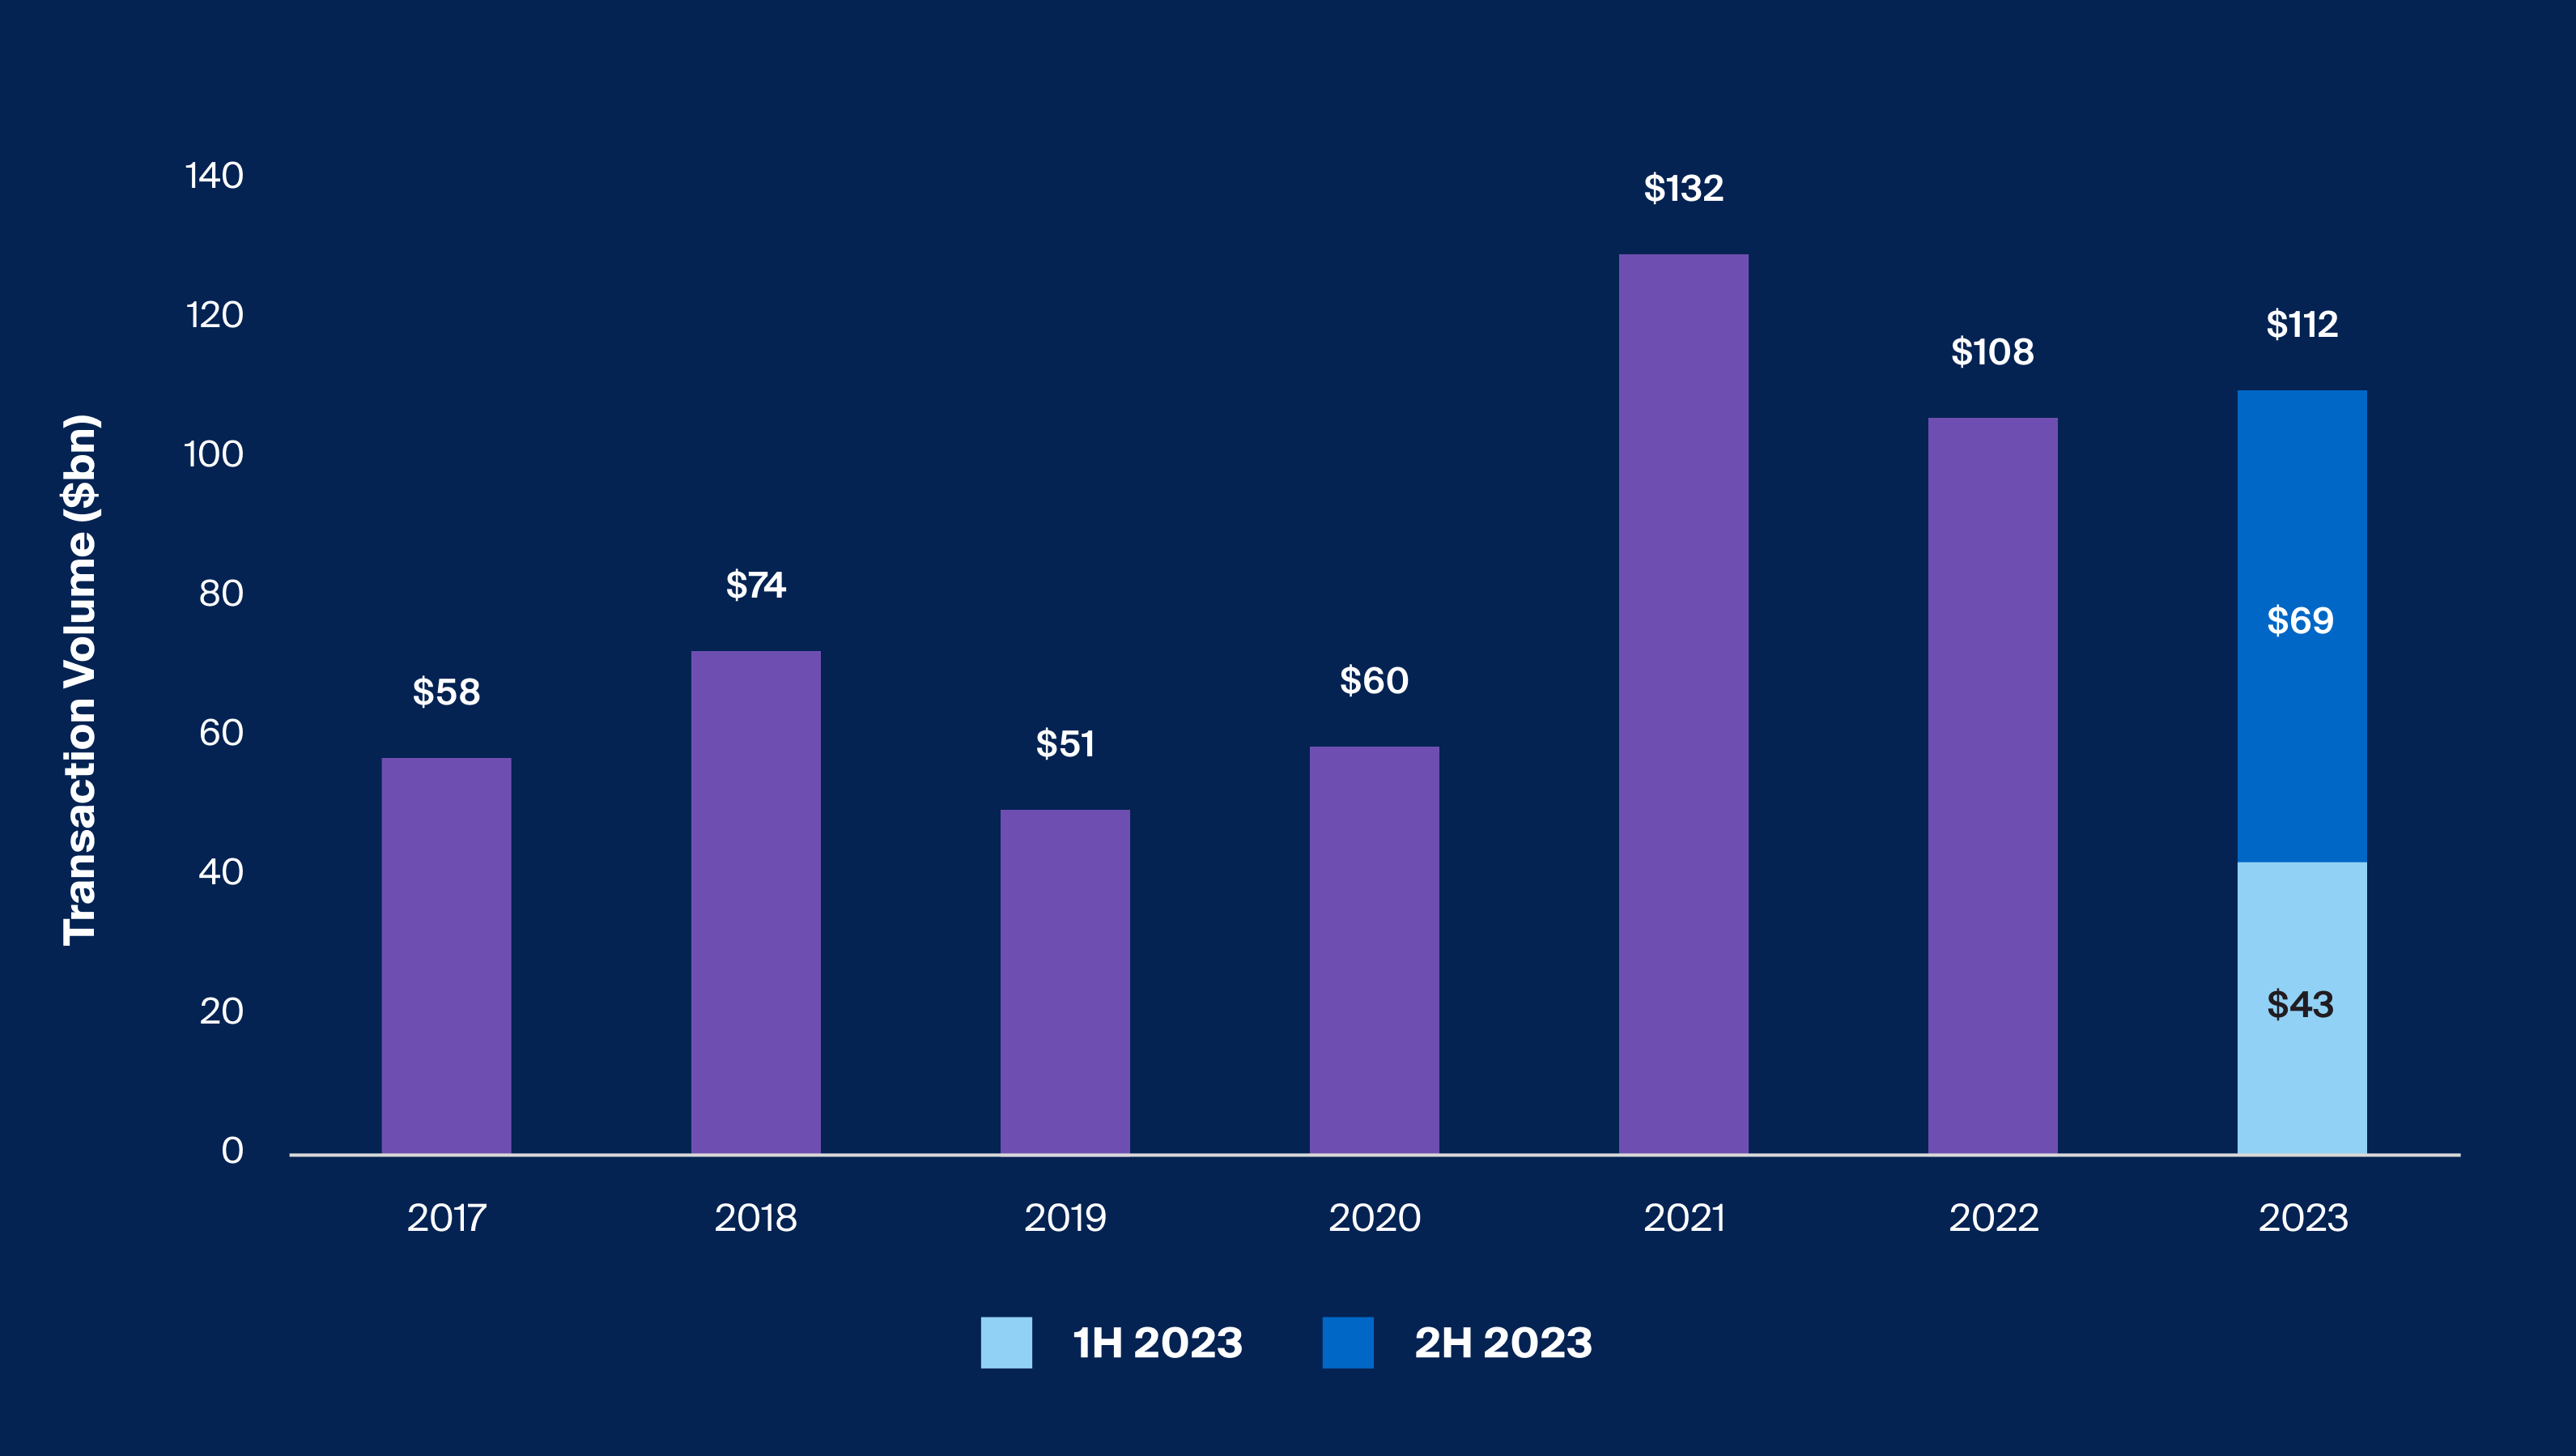
The resurgence in activity in the second half of 2023 after a more muted first half of the year has returned growth to its prior trend, with 2023 total transaction volumes at approximately $112 billion by year end - a steady Compound Annual Growth Rate (CAGR) of around 10% since 2017.2

Footnotes
Source: Jefferies Global Secondary Market Review; January 2024
Near-record volume in the second half of 2023 put the year back on trend with the historic growth trend (Exhibit 1)
Looking to 2024, market participants anticipate a steady flow of both GP-led and LP-led deals and project approximately $130 billion+ for secondary transaction volume, which would be a record year, surpassing the high in 2021.3
What’s driving the anticipated growth? This can be attributed to a few factors:4
Market Momentum: Enhanced by rallies in the public markets, which bolstered pricing, alongside growing liquidity needs among LPs.
Pricing: The narrowing of bid-ask spreads and improved pricing mechanisms appears to reflect a more nuanced understanding of value in the secondary market and reduced macroeconomic uncertainty impacting perceptions of valuation.
Supply and Demand: Despite record fundraising and an improved pricing environment, the supply and demand imbalance has favored well-capitalized secondary buyers, with an abundant supply of GP-led and LP-led deals expected in 2024 as traditional exits remain muted.
GP-Led Secondaries: Continuation Funds Appear To Be a Reliable Source of Realization
Despite a recovery in public markets and the easing of broader asset price volatility across global markets, traditional means of exit through M&A and IPO - while beginning to show signs of recovery - remained largely shut through the end of 2023.5 High nominal interest rates, persistent inflation and the intensification of regulatory oversight have all contributed to the slowdown in M&A and has most severely impacted specifically sponsor-backed M&A, down 40% since 2022.6 As for the IPO market, activity has yet to rebound from its substantial drop-off since 2021 records, as 2023 volume was down 38% since 2022, and down 83% versus 2021.7 These declines highlight the impact that slower global economic growth and challenges around post-IPO performance have had on traditional PE exit strategies. As a result of these declines, the means for GPs to realize portfolio investments continue to be challenged.
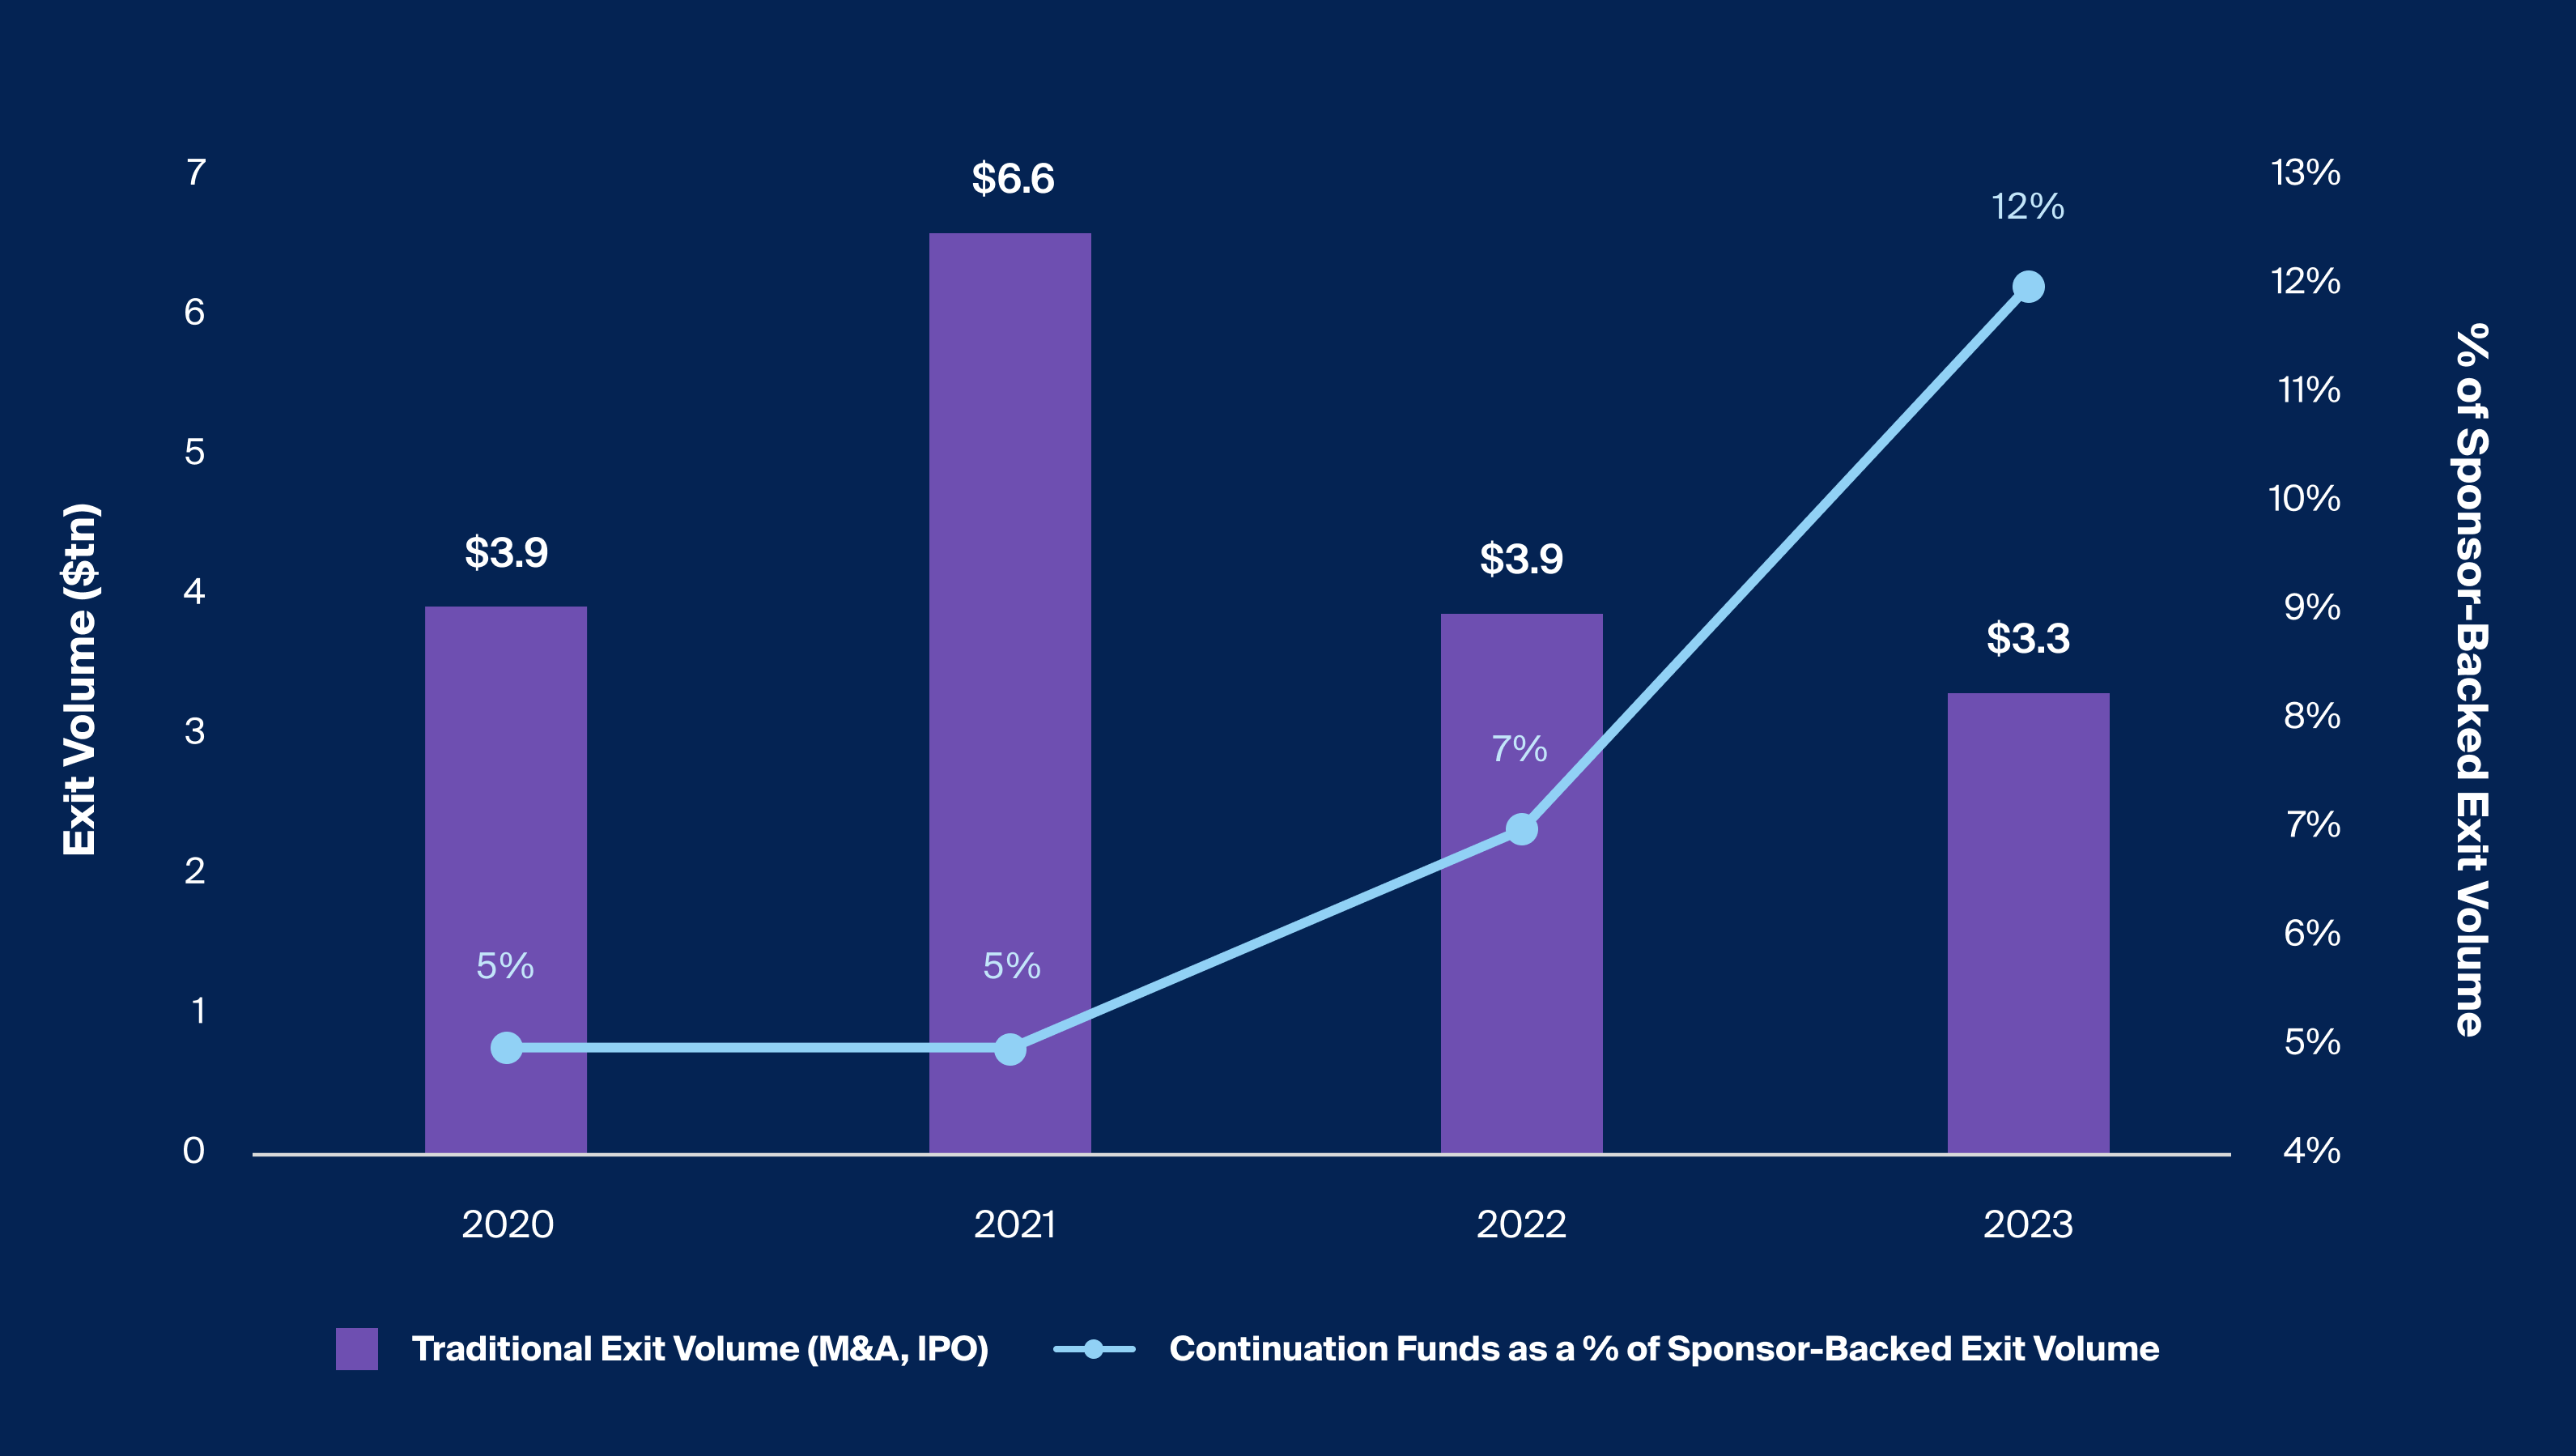
These ongoing challenges have continued to drive GPs to the secondary market as a tool to both generate liquidity and retain assets that may have additional upside as continuation vehicles have begun capturing not only a continually greater share of GP-led secondary market transaction volume, but a sizable share of sponsor-backed exit volume. In 2023, continuation fund volume as a percentage of GP-led volume not only grew to 88% of all GP-led volume, but these also continuation funds accounted for 12% of all sponsor-backed exits (Exhibit 2). GP-led secondaries continue to capture a greater share of the total secondary market, and are likely to see an uptick in the success rate of deal closures in 2024.8

Footnotes
Source: Jefferies Global Secondary Market Review; January 2024, Lazard, 2023 Secondary Market Review; February 2024
With traditional exit activity muted, GPs have increasingly turned to secondaries as a way to realize portfolio investments (Exhibit 2)
In addition, the rise of multi-asset continuation vehicles indicates that these structures once born as a means to extend the exit of mature assets into dedicated funds have evolved to support a larger gathering of assets. These funds and more diversified secondary offerings are gaining favor and now represent about 59% of the continuation fund activity in 2023, up from 41% in 2022, as a strategy to speed up fund distributions and address vehicles nearing the end of their terms.9
LP-Led Secondaries: With Distributions Still Lacking, LPs Tap the Secondary Market To Fund New Commitments
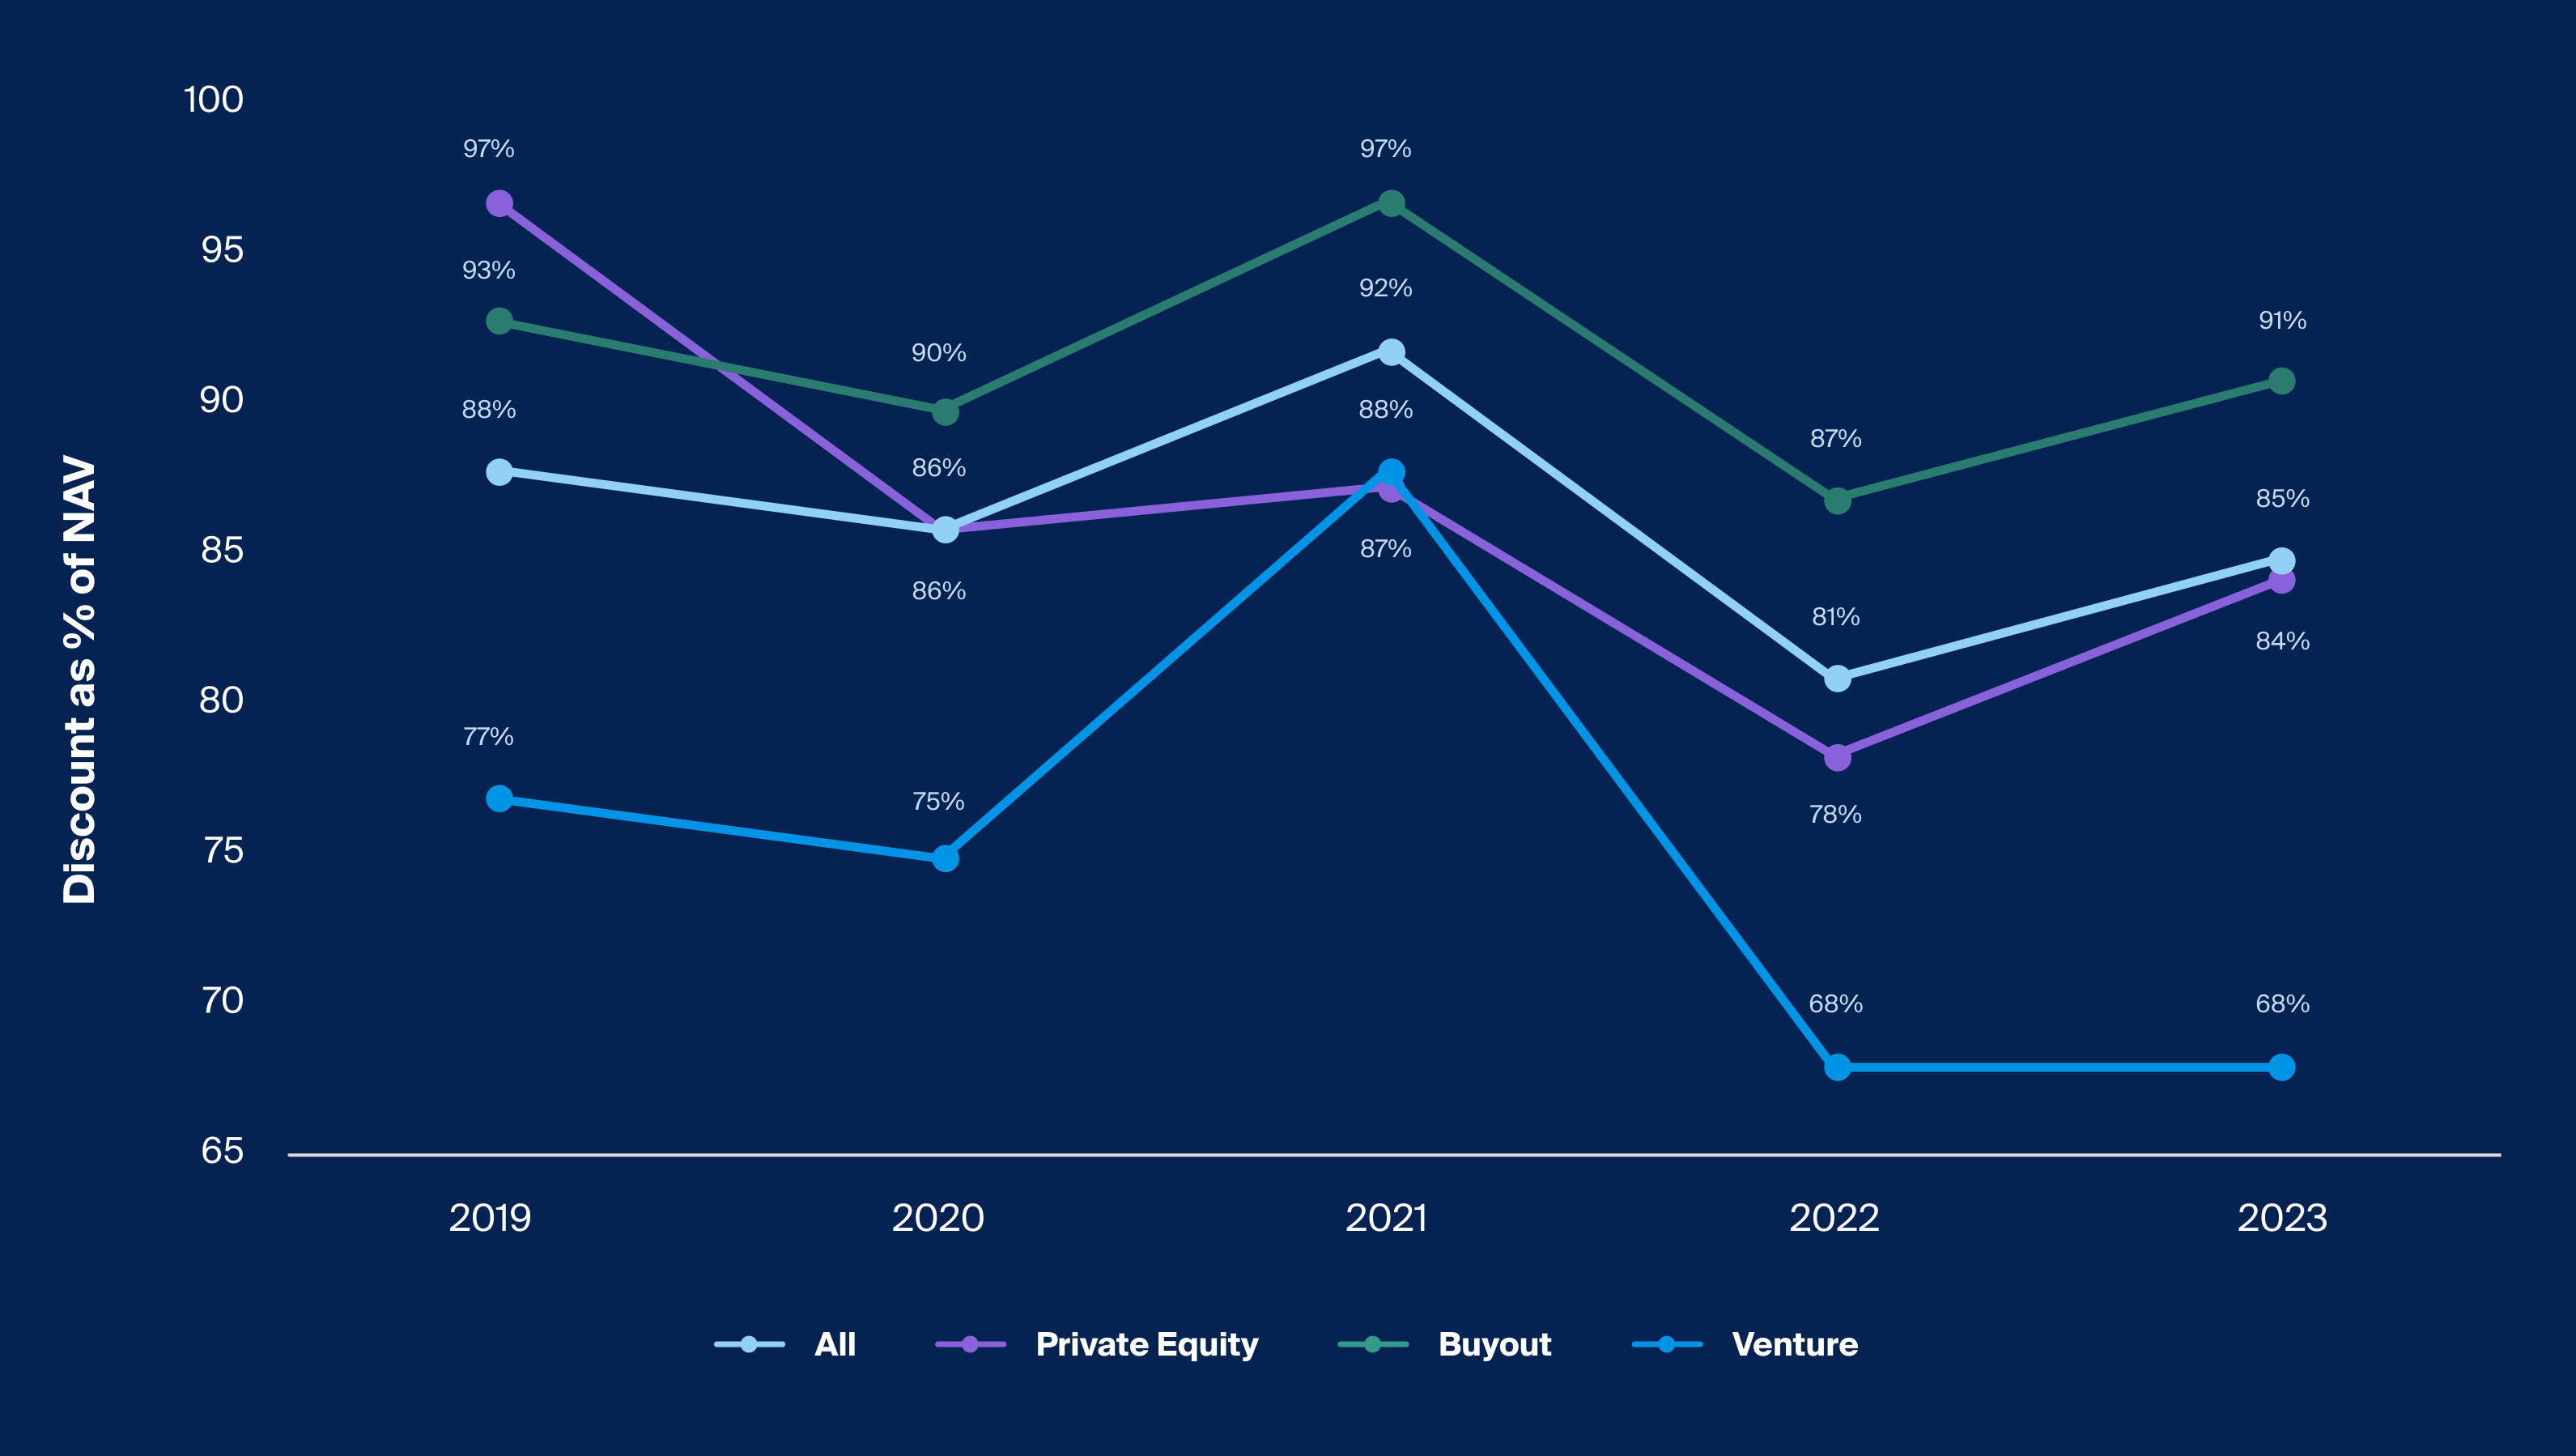
The recovery in public markets diminished the impact of the denominator effect on LP portfolios, but it had other effects in the secondary market which has stimulated activity. By the end of 2023, LP secondary market pricing had experienced a considerable recovery from the decade-low levels of 2022, as pricing broadly rebounded by nearly 400 basis points to 85% of NAV.10 There was also a continued dispersion between pricing for different private equity asset types, as venture pricing remained well below pricing for buyout transactions.

Footnotes
Source: Jefferies Global Secondary Market Review; January 2024, Campbell Lutyens 2024 Secondary Market Overview
LP pricing for secondary transactions rebounds, yet dispersion of strategies persists as venture remains at discount (Exhibit 3)
Issues that persist on the GP side of the equation are also impacting LPs, as 44% of LPs cite liquidity as the primary means of sale, up from 10% in 2022, where the story was dominated by challenges of portfolio management and the denominator effect. This comes alongside 63% of respondents indicating an excess in capital calls relative to their distributions in existing portfolios, as the challenge of GP liquidity in generating DPI directly impact LPs and their liquidity management strategies.11
As a proportion of total estimated secondary market volume, LP-led volumes held constant at around ~60% in both 2022 (57%) and 2023 (56%) as secondary buyers continued to focus deployment away from concentrated GP-led exposures into more diversified opportunities like the multi-asset continuation funds highlighted in the section above. Industry participants foresee a further narrowing of bid-ask spread in 202412, which may drive more conviction toward transactions and volume, as secondary pricing continues to rise amidst anticipated interest rate cuts and record buy-side capital entering the space (Exhibit 4).
Supply vs. Demand Imbalance Persists, a Tailwind for Well Capitalized Buyers
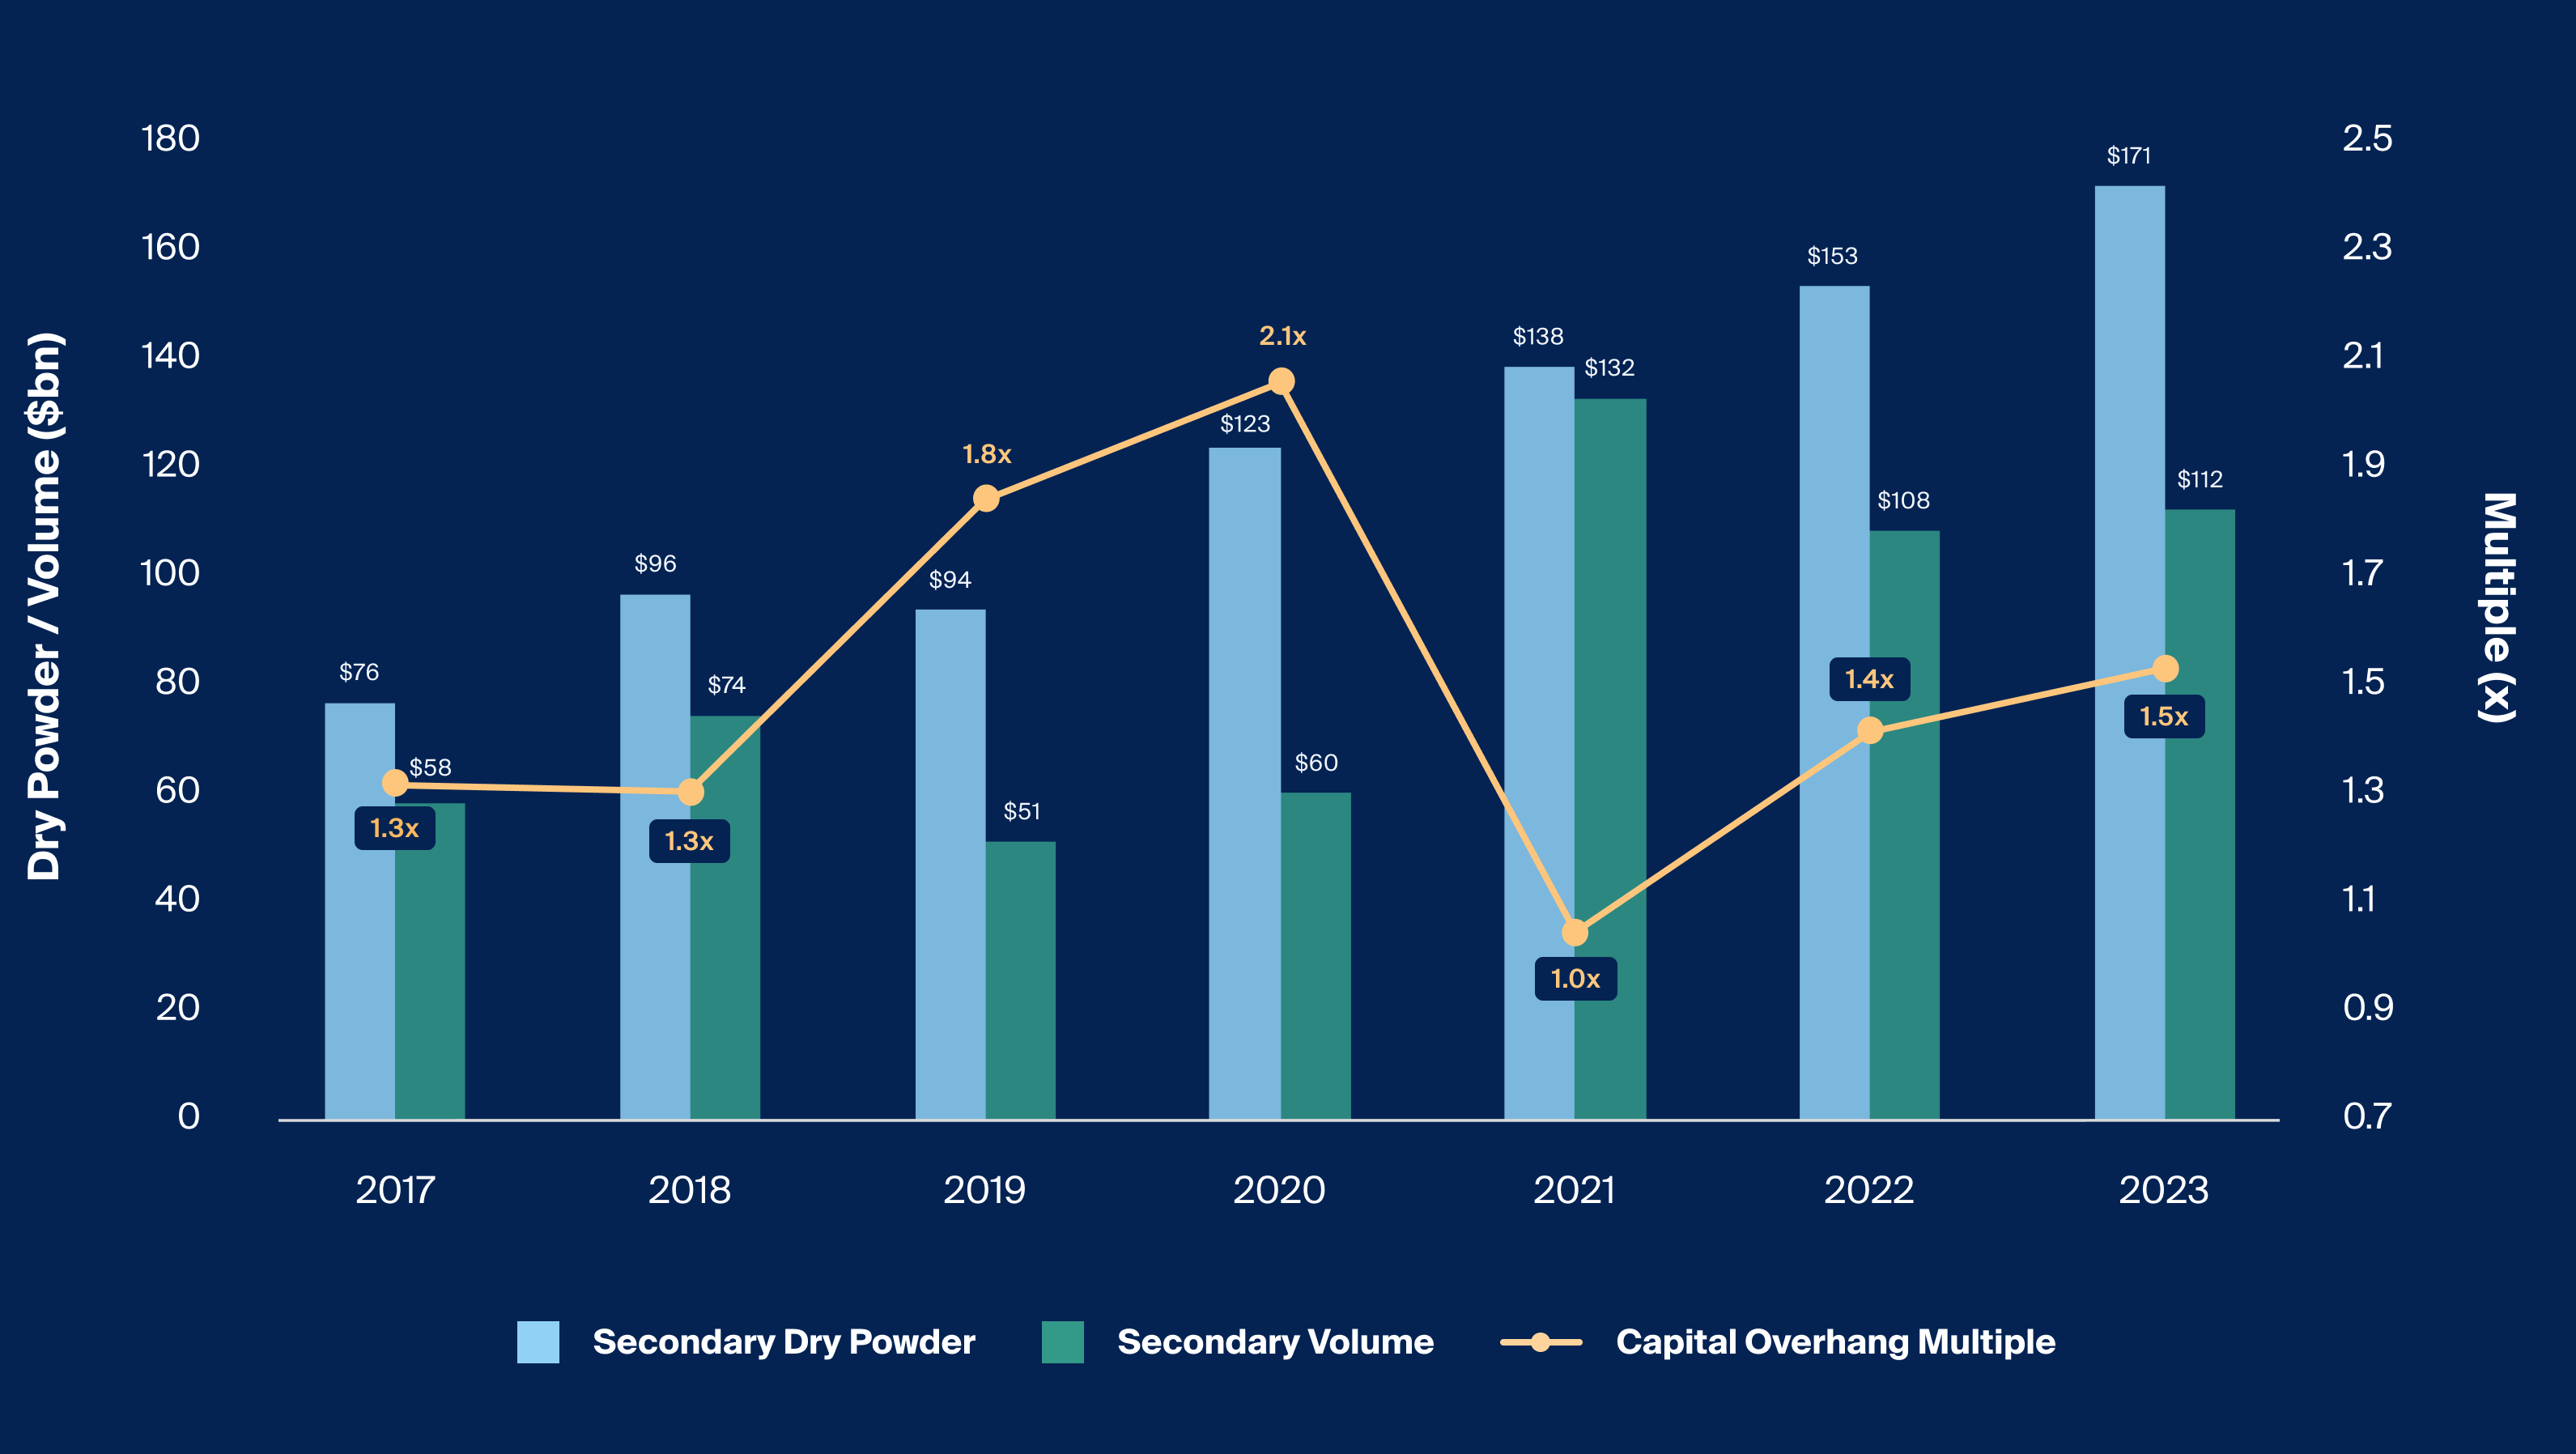
Secondary market fundraising saw record levels in 2023, raising $91 billion, exceeding the previously established all time highs reached in 2020.13 The result of this surge in fundraising is an explosion of dry powder, which exceeded its all time highs to reach nearly $170 billion.14 Despite this recent meteoric rise in secondary capital (“demand”), the rise in transaction volume (“supply”) has largely remained on pace (Exhibit 4). An outsized increase in demand without a symmetrical increase in supply would present a deal market generally unfavorable for buyers, as competition for a finite number of deals could lead to pricing discrepancy, among other challenges. As transaction volume in the first half of the year was low, many began to worry these challenges would persist through the year. This multiple however, of dedicated dry powder to secondary volume of 1.5x in 2023 is still in line with the recent historical average of 1.5x from 2017-2022 (Exhibit 4). Compared to primary private equity – which has had a considerably higher overhang multiple – the secondary market appears undercapitalized and thus still favors secondary buyers.

Footnotes
Source: Jefferies Global Secondary Market Review; January 2024, Preqin, Secondar Dry Powder, as of December, 2023
Capital overhang remains a headwind for buyers, but with transaction volume set to persist, this multiple may recede (Exhibit 4)
Secondaries Appear To Be Delivering on Their Appeal, and Continue To Expand Beyond Private Equity Into Other Asset Classes
Secondaries appear to drive out-performance relative to other alternative asset classes, and is in fact the only alternative asset class for which the 4th quartile of funds have historically generated a positive return.15
Secondary assets are often more mature in their lifecycle and as such, buyers are better able to price portfolios or assets towards the value realization potential as opposed to allocating to a blind pool. These assets may also provide a quicker return on investment compared to standard private capital ventures, as assets are acquired closer to their maturity. Acquiring stakes in private capital via secondaries presents a different avenue for investors new to private markets who aim to achieve diversification in their portfolios. These strategies can represent some of the fastest-developing areas of the secondary market as GPs search for opportunity amid an economic environment characterized by continued liquidity challenges.
The PE secondary market appears poised for a robust year as pricing discrepancies narrow, well capitalized buyers are positioned to transact at scale, and a greater proportion of both LPs and GPs continue to adopt the secondary market as part of their portfolio management toolkit. As the secondary market continues to mature, both LPs and GPs are broadening into additional asset classes beyond private equity and beginning to transact on real estate, infrastructure, and private debt portfolio interests and assets – offering both a growing and new set of opportunities for secondary investors.
While the opportunity set for private equity secondaries may remain compelling, investors should understand that secondaries, across asset classes, also have their own set of risks. Like many private market strategies, secondaries funds tend to acquire illiquid interests in private companies; consequently, these funds may offer less liquidity when compared to public markets.
In addition, the ongoing return potential of fund’s underlying portfolio companies is not guaranteed, and investors may still lose all or some of the capital they invest. Though investment durations tend to be shorter, secondaries investments may still be relatively illiquid, especially if demand for certain managers or their funds declines. Investors in fund-of-funds or specialized secondary funds also face two tiers of GPs and potentially additional fees and expenses as a result.


