We started the year with record highs in global equity markets and a general expectation that the U.S. Federal Reserve (the Fed) would hike interest rates to tame the multi-decade high rate of inflation. At the time, we believed that these conditions - along with rising correlations between stocks and bonds and low expected returns - warranted a reassessment of the appropriateness of the 60/40 stock/bond portfolio (60/40 portfolio). We also presented the case for the inclusion of alternative investments to seek to enhance return, diversify risk and supplement income.
Given the historically poor start to the year that stocks, bonds and the 60/40 portfolio have had - which we previously addressed - we believe it may be time for investors to expand their investment universe and learn more about alternative investments. This includes private equity and debt, hedge funds, real estate, digital assets and numerous other strategies.
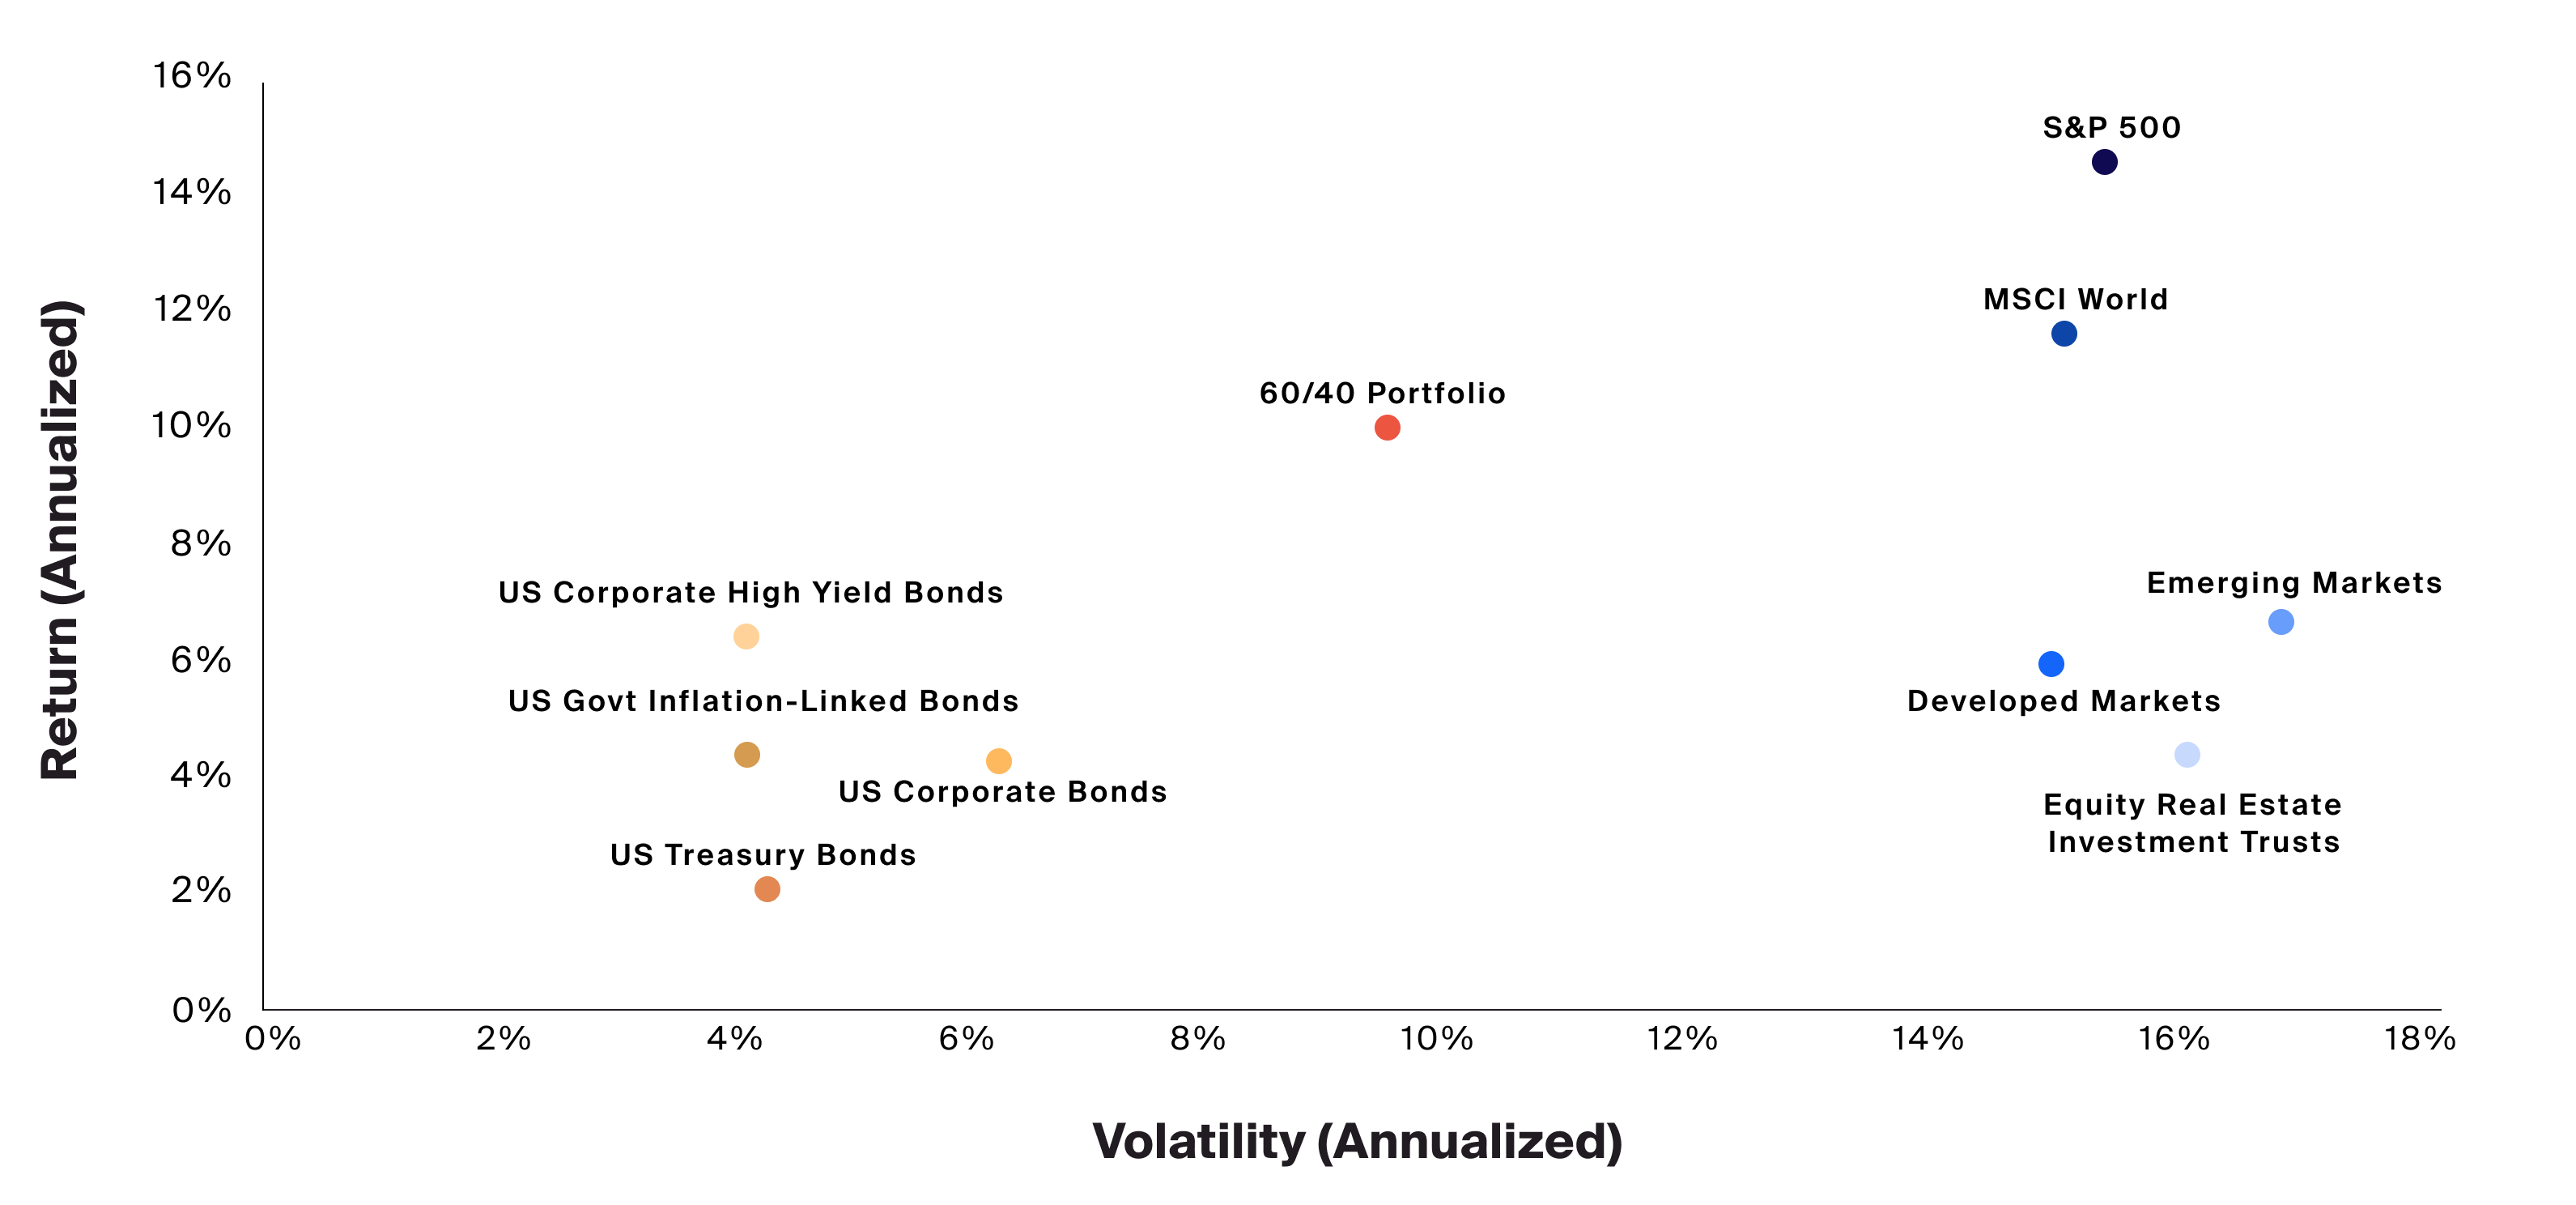
As a reminder, it can be helpful to look at the past to get a sense of what to expect in the future, however, it’s also important to remember that past performance is not always a guarantee or indicator of future returns. To this end, the below chart shows the annualized risk and return for traditional investments like stocks and bonds, as well as the 60/40 portfolio.
Source: Bloomberg, as of Q3 2021, S&P 500 represented by the SPX Index, MSCI World represented by the MXWO Index, Developed Markets represented by the MXEA Index, Emerging Markets represented by the MXEF Index, Equity Real Estate Investment Trusts represented by the FNER Index, US Treasury Bonds represented by the LUATTRUU Index, US Govt Inflation-Linked Bonds represented by the BCIT1T Index, US Corporate Bonds represented by the LUACTRUU Index, US Corporate High Yield Bonds represented by the LF98TRUU Index, 60/40 Portfolio represented by the SPX Index and LBUSTRUU Index.
The chart shows the annualized risk and return for traditional investments like stocks and bonds, as well as the 60/40 portfolio.
There appears to be a clear relationship between the risk and return of these investments, and the adage the greater the risk, the greater the potential return seems to apply well here. As illustrated above, stocks are generally riskier than bonds, but have historically delivered a higher return over the long term to compensate investors for the higher risk. Since the 60/40 portfolio represents a mixture of both, it makes sense that its historical risk sits somewhere in between.
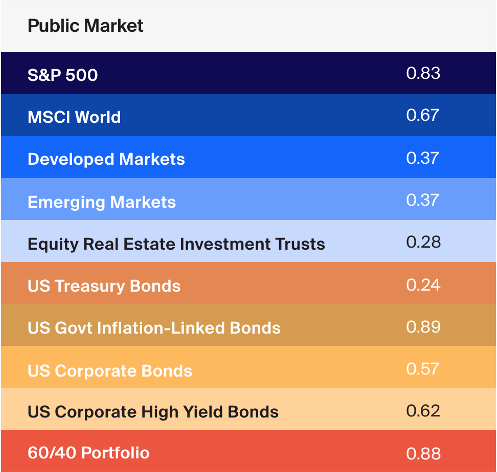
What is also of interest is that over the past five years, none of these investments has fully compensated investors with an equal return since each asset’s risk-adjusted return, as measured by the Sharpe ratio, is below 1.0 – less return per unit of risk.
Source: Venn, as of Q3 2021, Bloomberg, as of Q3 2021, S&P 500 represented by the SPX Index, MSCI World represented by the MXWO Index, Developed Markets represented by the MXEA Index, Emerging Markets represented by the MXEF Index, Equity Real Estate Investment Trusts represented by the FNER Index, US Treasury Bonds represented by the LUATTRUU Index, US Govt Inflation-Linked Bonds represented by the BCIT1T Index, US Corporate Bonds represented by the LUACTRUU Index, US Corporate High Yield Bonds represented by the LF98TRUU Index, 60/40 Portfolio represented by the SPX Index and LBUSTRUU Index. Preqin, as of Q3 2021, Private Equity represented by the Preqin Private Equity Quarterly Index, Venture Capital represented by the Preqin Venture Capital Quarterly Index, Real Estate represented by the Preqin Real Estate Quarterly Index, Infrastructure represented by the Preqin Infrastructure Quarterly Index, Private Debt represented by the Preqin Private Debt Quarterly Index, Natural Resources represented by the Preqin Natural Resources Quarterly Index. HFR, as of Q3 2021, Hedge Funds represented by the HFRI Fund Weighted Composite Index.
What is also of interest is that over the past five years, none of these investments has fully compensated investors with an equal return since each asset’s risk-adjusted return, as measured by the Sharpe ratio, is below 1.0 – less return per unit of risk.
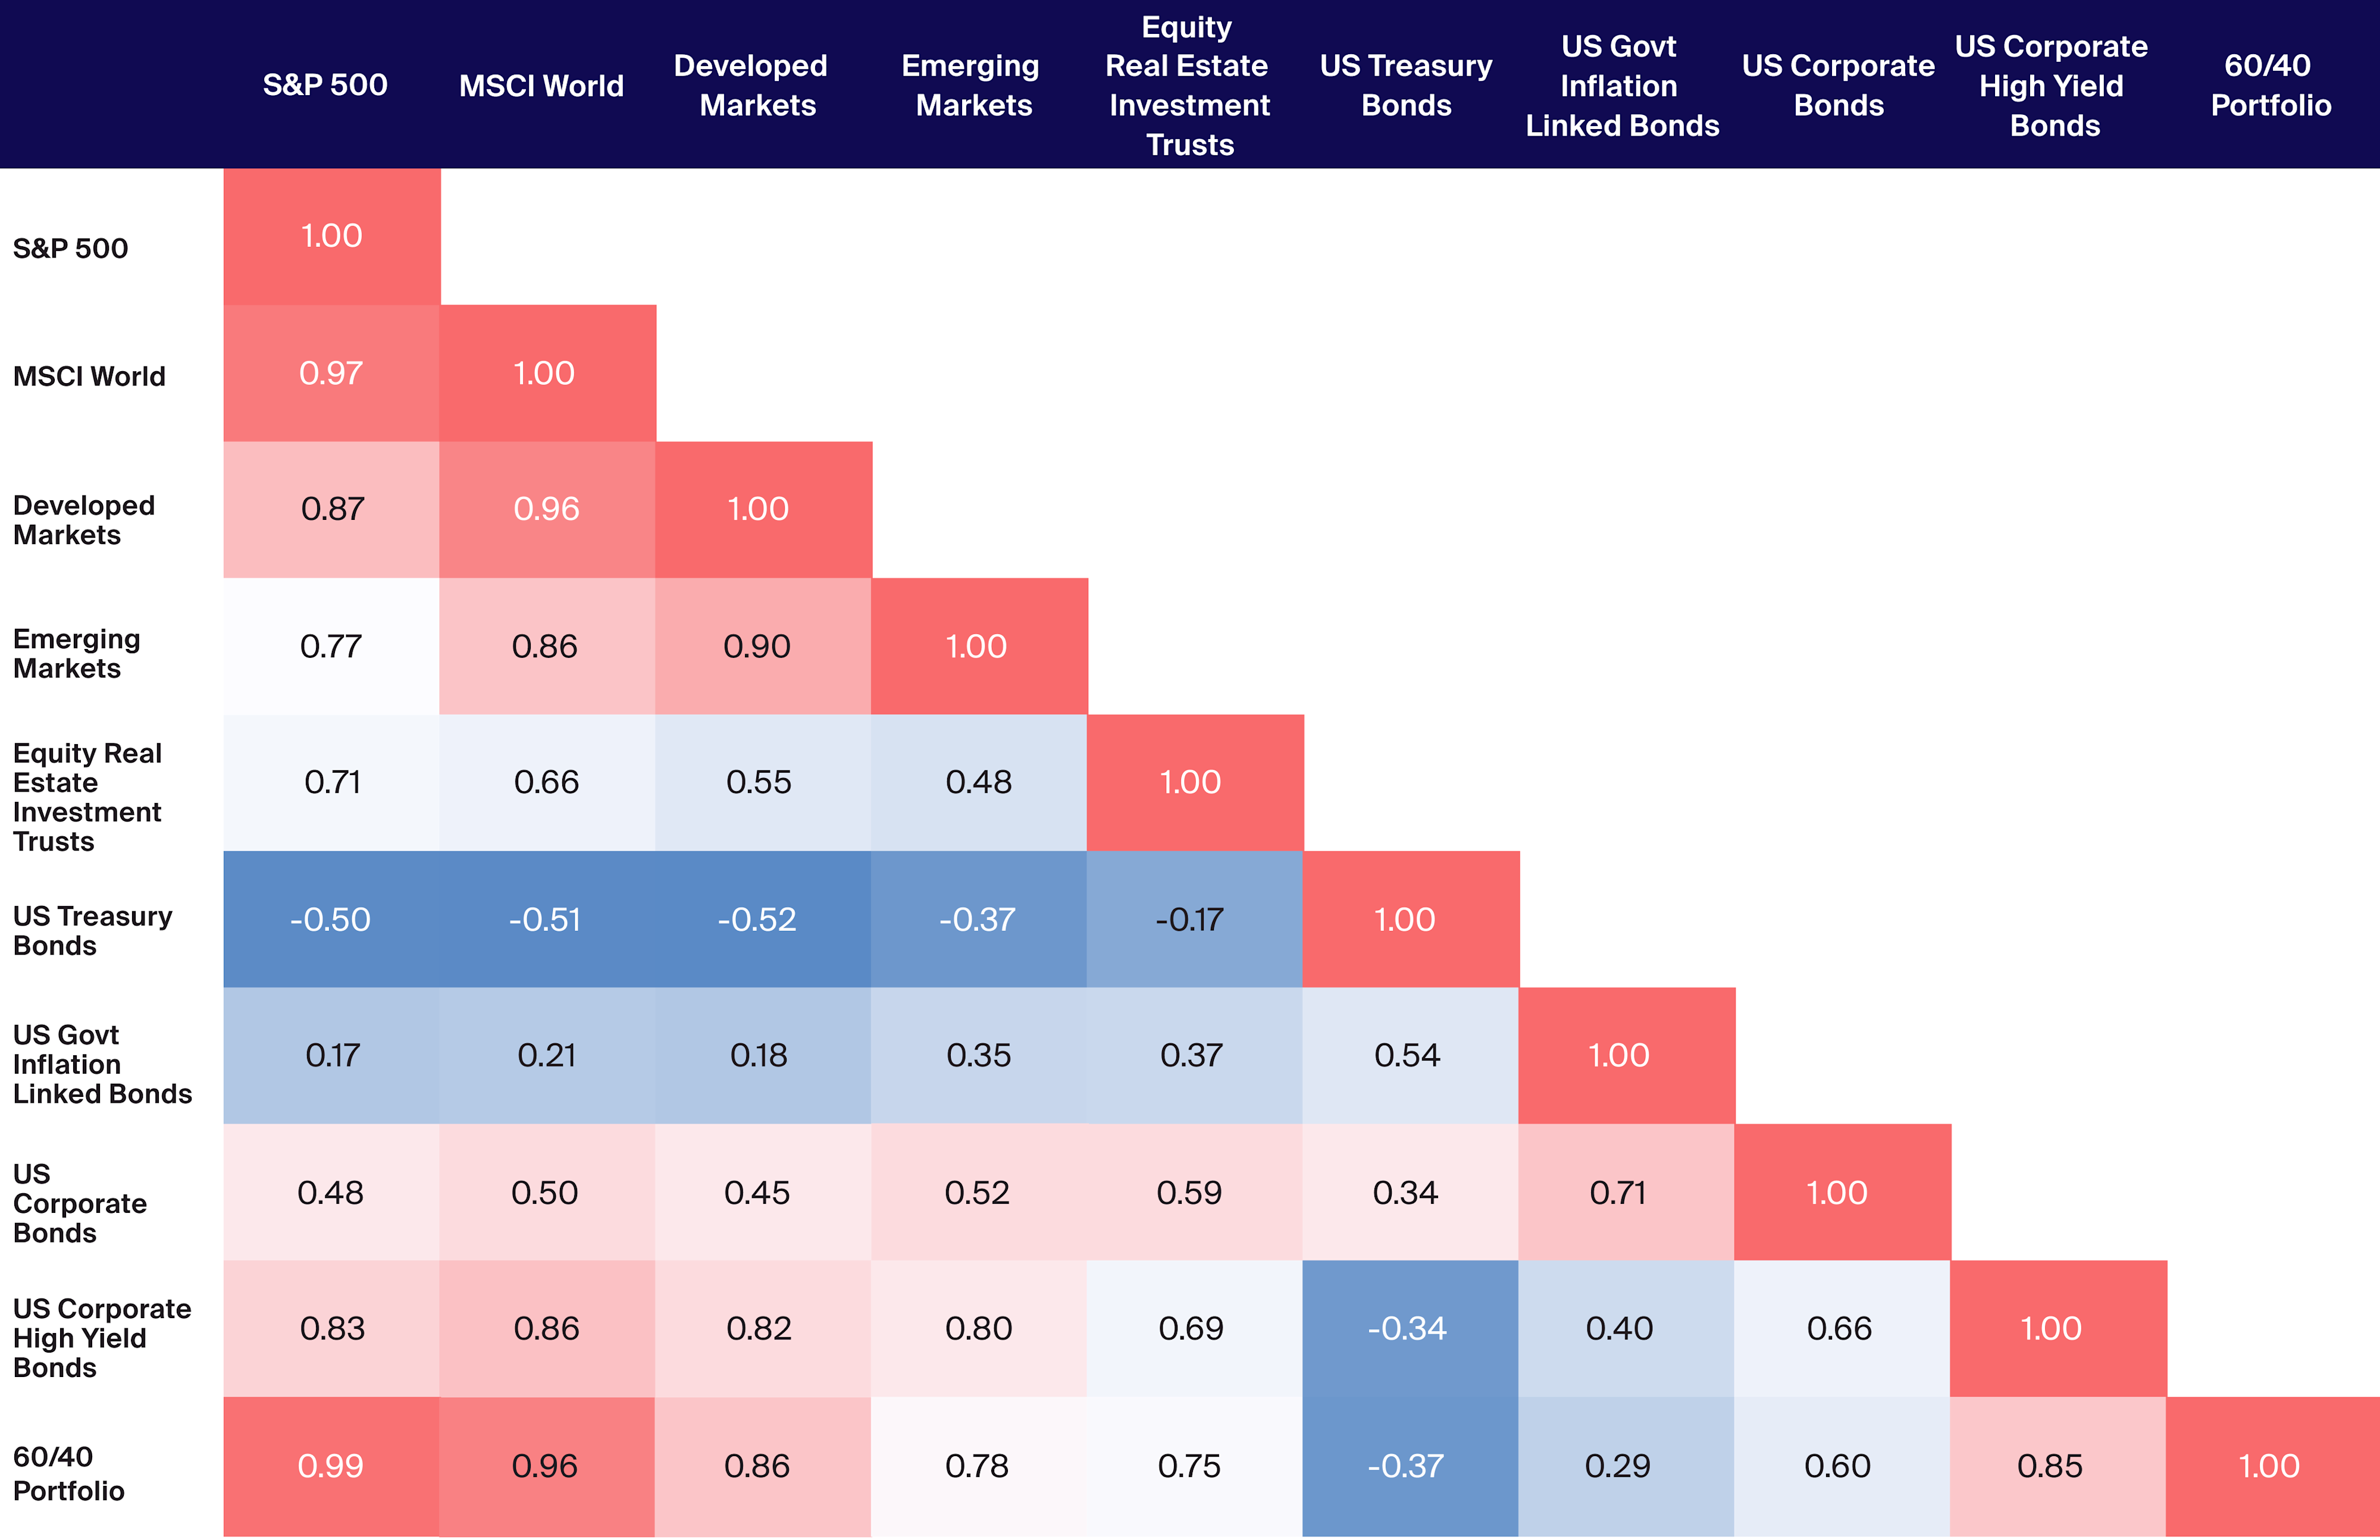
While risk and return are not the only considerations investors need to plan for when it comes to investment decisions, correlation between asset classes may be used measure the degree to which the prices of two assets move in conjunction with each other. Below we can see the correlation coefficients of these assets over a ten-year horizon. It is generally viewed that a correlation over 0.5 is a moderate correlation, while a correlation over 0.75 is a strong correlation.1 It makes intuitive sense that similar assets like stocks would be positively correlated, but it’s the correlation between stocks and bonds that is surprising here since they are not only positively correlated but are moderate-to-strongly correlated with one another. This may reduce the defensive benefit that lowly or negatively correlated assets may provide to an overall portfolio.
Source: Bloomberg, as of Q3 2021, S&P 500 represented by the SPX Index, MSCI World represented MXWO Index, Developed Markets represented by the MXEA Index, Emerging Markets represented by the MXEF Index, Equity Real Estate Investment Trusts represented by the FNER Index, US Treasury Bonds represented by the LUATTRUU Index, US Govt Inflation-Linked Bonds represented by the BCIT1T Index, US Corporate Bonds represented by the LUACTRUU Index, US Corporate High Yield Bonds represented by the LF98TRUU Index, 60/40 Portfolio represented by the SPX Index and LBUSTRUU Index.
It makes intuitive sense that similar assets like stocks would be positively correlated, but it’s the correlation between stocks and bonds that is surprising here since they are not only positively correlated but are moderate-to-strongly correlated with one another. This may reduce the defensive benefit that lowly or negatively correlated assets may provide to an overall portfolio.
Additionally, a correlation on the upside may benefit investors in terms of upside appreciation as asset class returns will typically move higher all at once. The problem can come when these assets move lower together, as experienced since the start of this year.
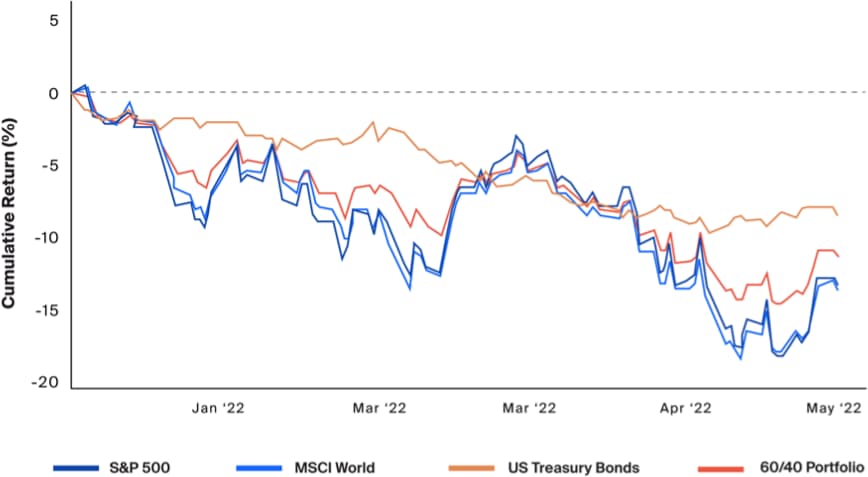
Source: Bloomberg, as of 5/2022, S&P represented by the SPX Index, MSCI World represented by the MXWO Index, US Treasury Bonds represented by the LUATTRUU Index, 60/40 Portfolio represented by the SPX Index and LBUSTRUU Index.
A correlation on the upside may benefit investors in terms of upside appreciation as asset class returns will typically move higher all at once. The problem can come when these assets move lower together, as experienced since the start of this year.
Given the above, we believe it is time for investors to expand their opportunity set to learn about the potential benefits and risks of alternative investments.
Expand to Embrace the New Normal
As previously mentioned and discussed, the 60/40 portfolio is off to its worst start in 20 years. In addition to this headwind, we are also experiencing the highest level of inflation in over 40 years. The Fed and other global central banks will embark on a secular tightening cycle2 that is expected to see interest rates hit levels significantly higher than where they started this year3. Against such a backdrop, we believe there is an opportunity for investors to expand their investment universe and learn about alternatives to seek to enhance return, diversify risk and supplement income.
Adapting to pervasive market volatility through the inclusion of alternatives gives investors a greater opportunity set from which to select. Not only may we unlock access to a range of asset classes and strategies that offer exposure to alternative drivers of return, but these assets may also offer a range of other benefits, including potentially a more attractive risk-adjusted return and a lower correlation to stocks and bonds.
Adding alternative asset classes to the annualized risk and return chart, we see that they generally move up (higher potential return) and to the left (less potential risk) relative to their traditional equivalents. For example, public equities as represented by the S&P 500 Index had an annualized 5-year return of 14.7% with a risk of a 15.2% standard deviation, while private equities as represented by the Preqin Private Equity Index had returns of 21.0% for a risk of 9.0% over the same period.
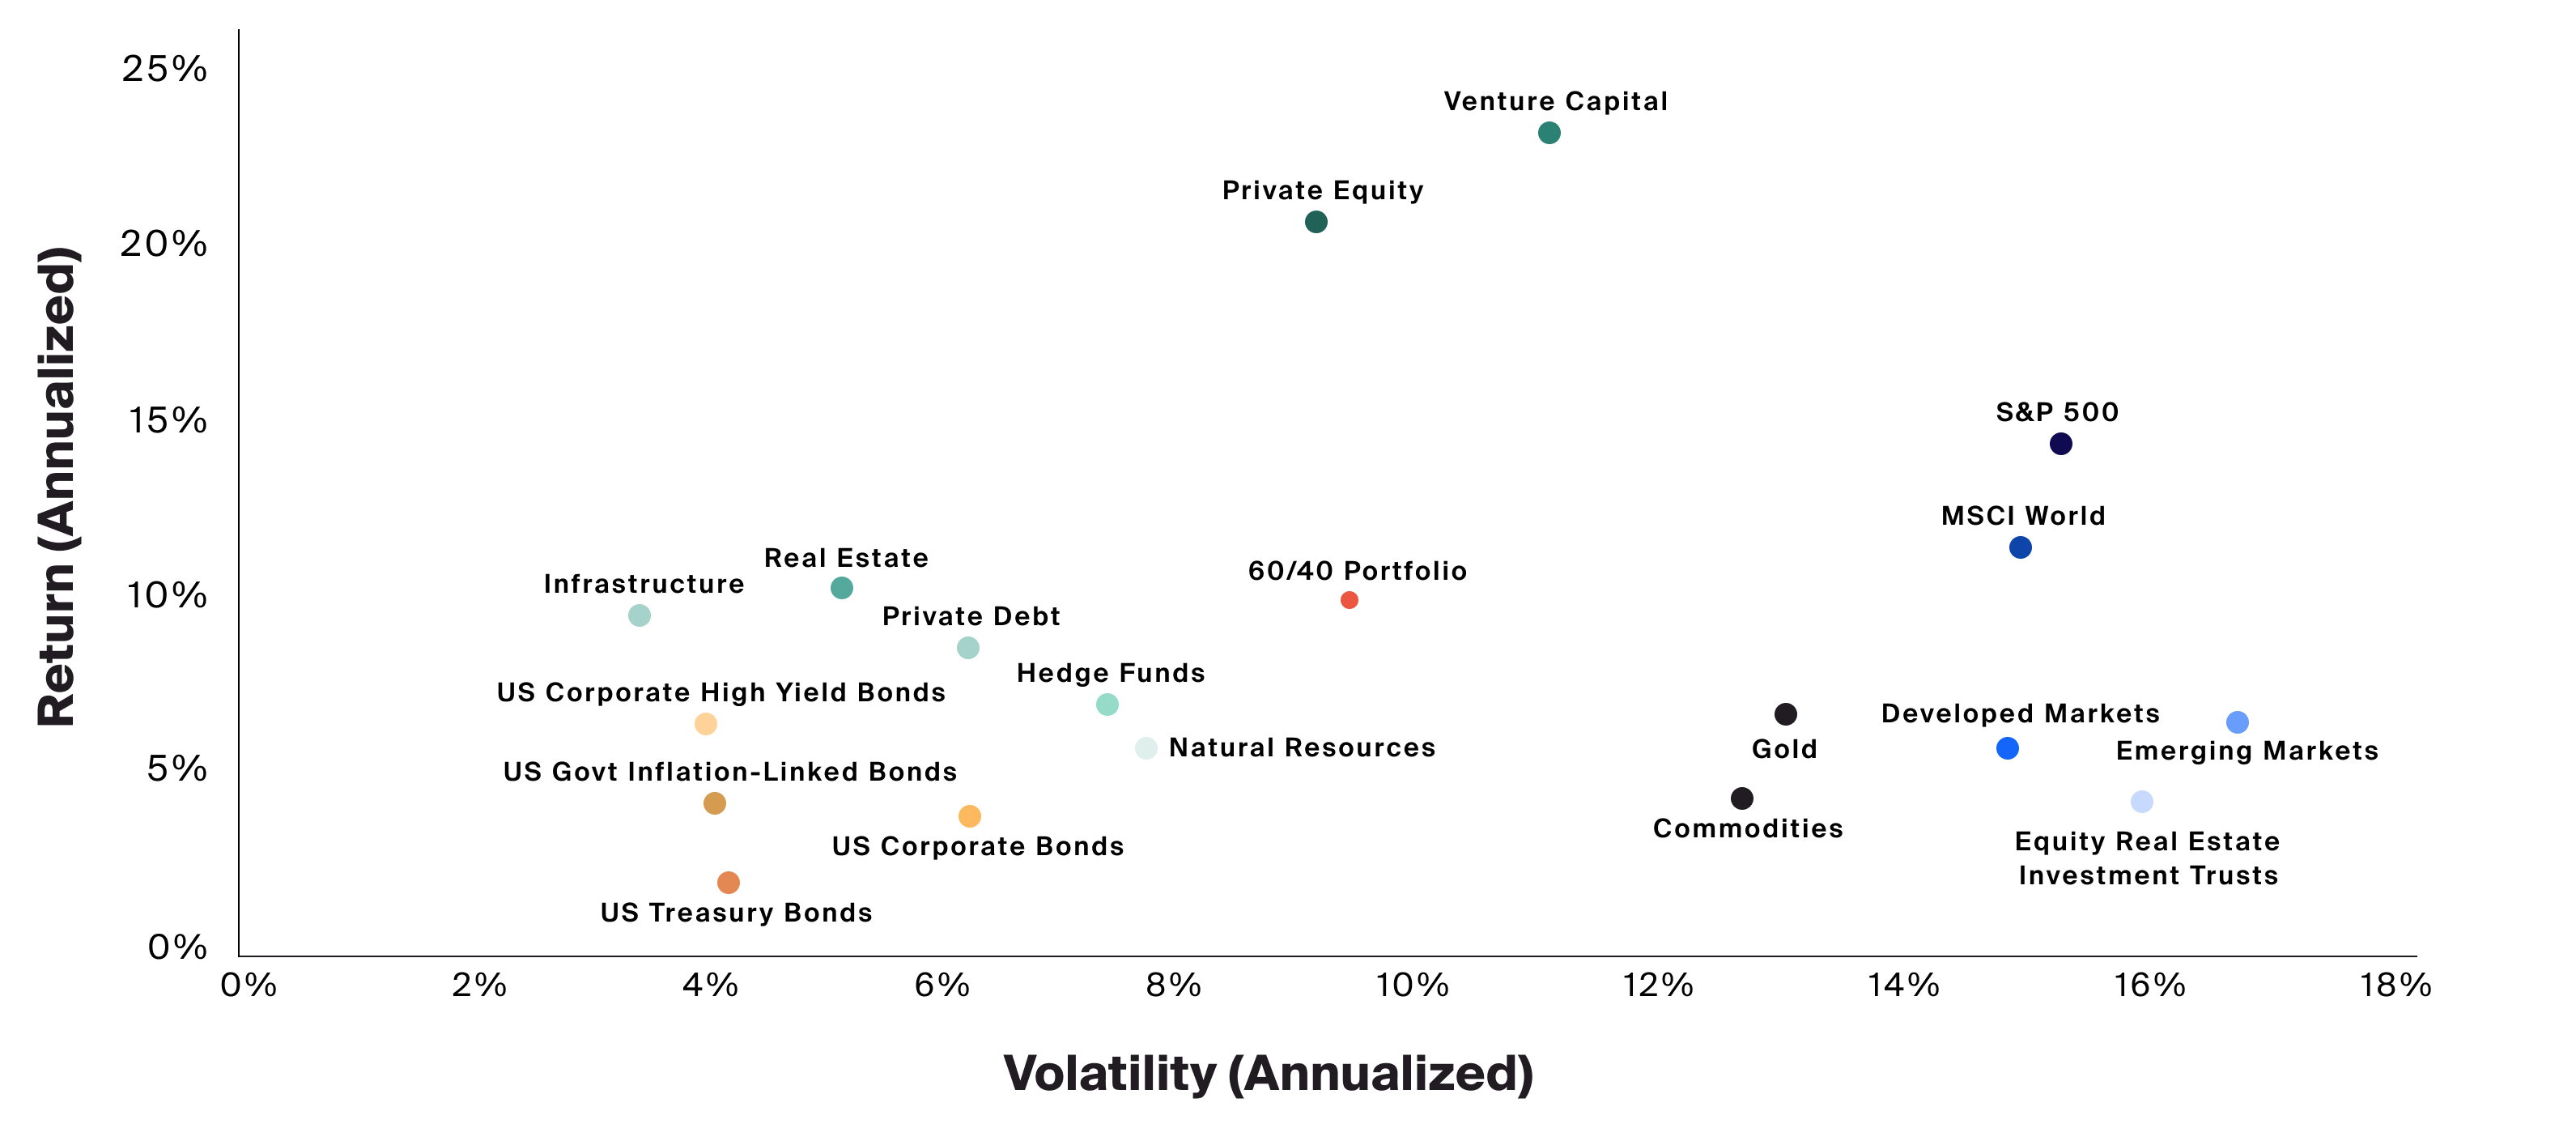
Source: Bloomberg, as of Q3 2021, S&P 500 represented by the SPX Index, MSCI World represented by the MXWO Index, Developed Markets represented by the MXEA Index, Emerging Markets represented by the MXEF Index, Equity Real Estate Investment Trusts represented by the FNER Index, US Treasury Bonds represented by the LUATTRUU Index, US Govt Inflation-Linked Bonds represented by the BCIT1T Index, US Corporate Bonds represented by the LUACTRUU Index, US Corporate High Yield Bonds represented by the LF98TRUU Index, 60/40 Portfolio represented by the SPX Index and LBUSTRUU Index. Gold represented by XAUUSD currency. Commodities represented by the BCOMTR Index. Preqin, as of Q3 2021, Private Equity represented by the Preqin Private Equity Quarterly Index, Venture Capital represented by the Preqin Venture Capital Quarterly Index, Real Estate represented by the Preqin Real Estate Quarterly Index, Infrastructure represented by the Preqin Infrastructure Quarterly Index, Private Debt represented by the Preqin Private Debt Quarterly Index, Natural Resources represented by the Preqin Natural Resources Quarterly Index, HFR, as of Q3 2021, Hedge Funds represented by the HFRI Fund Weighted Composite Index.
Adding alternative asset classes to the annualized risk and return chart, we see that they generally move up (higher potential return) and to the left (less potential risk) relative to their traditional equivalents. For example, public equities as represented by the S&P 500 Index had an annualized 5-year return of 14.7% with a risk of a 15.2% standard deviation, while private equities as represented by the Preqin Private Equity Index had returns of 21.0% for a risk of 9.0% over the same period.
This expanded opportunity set has also historically proven to provide access to a more efficient return and a greater return per unit of risk as measured by Sharpe ratios over 1.0. This feature of alternatives may allow for a more balanced risk budgeting process, since investors may accommodate an appropriate level of risk while seeking to maximize potential expected return - selecting those asset classes with the highest Sharpe ratios while being aware of the risk associated with each investment.
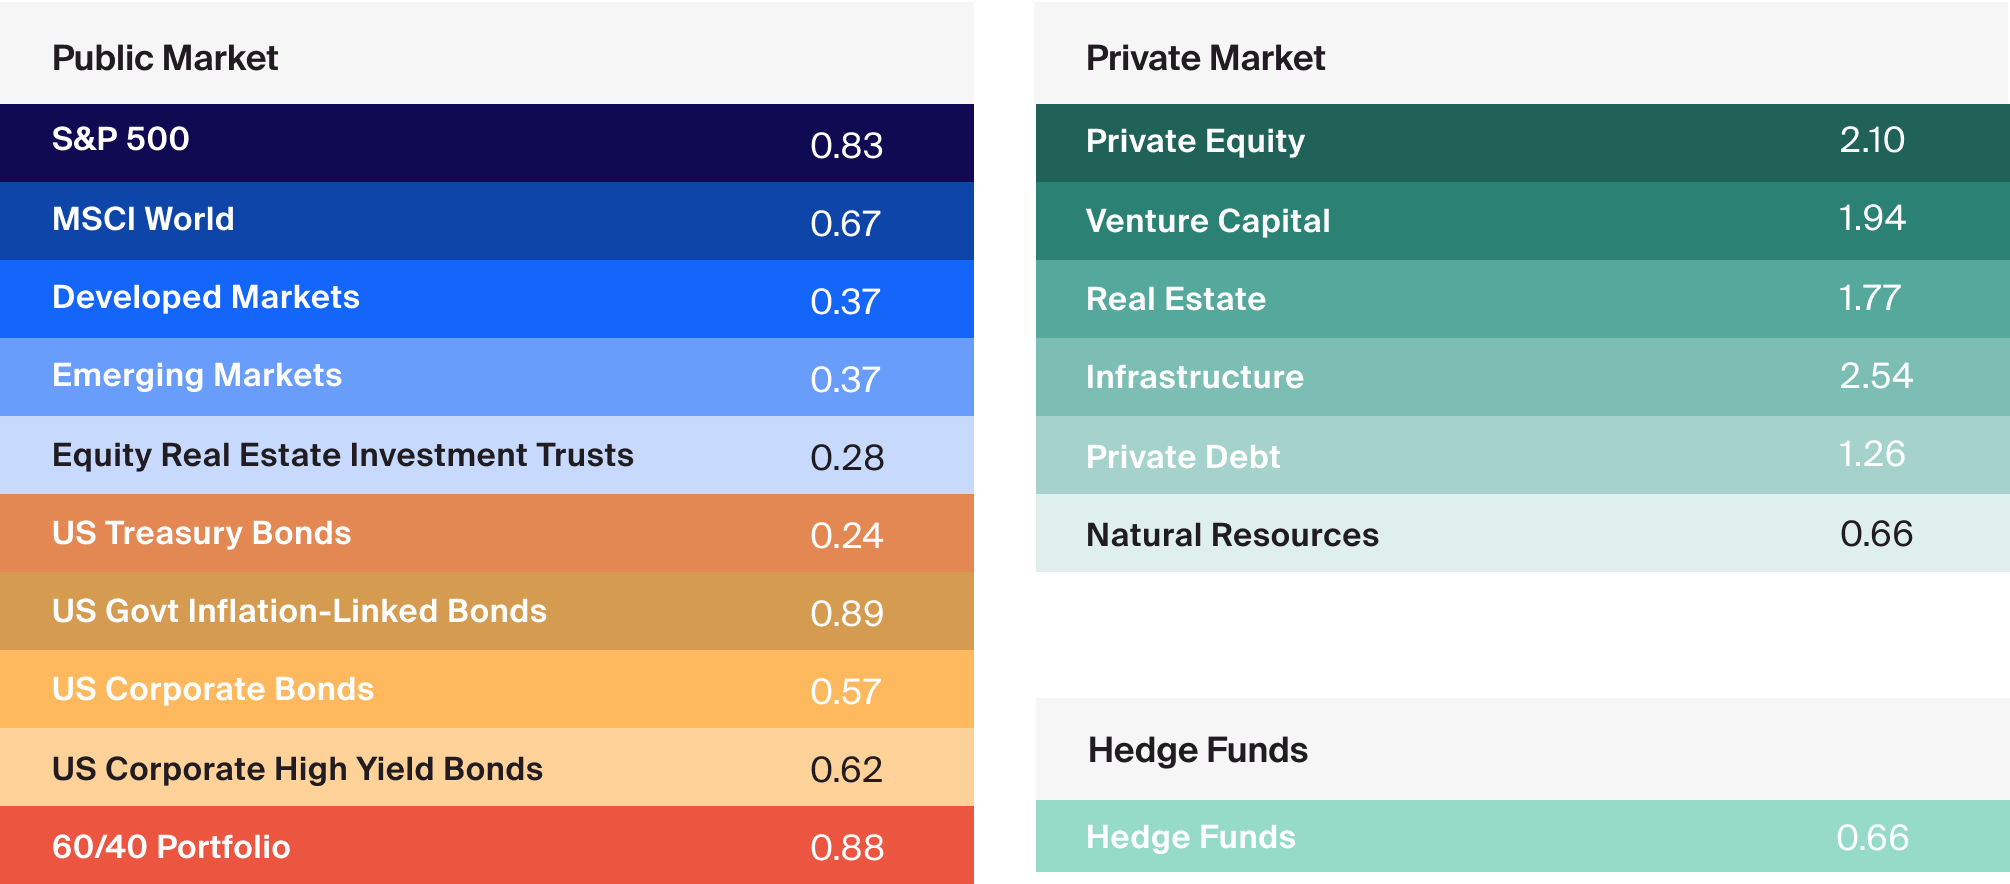
Source: Venn, as of Q3 2021, Bloomberg, as of Q3 2021, S&P 500 represented by the SPX Index, MSCI World represented by the MXWO Index, Developed Markets represented by the MXEA Index, Emerging Markets represented by the MXEF Index, Equity Real Estate Investment Trusts represented by the FNER Index, US Treasury Bonds represented by the LUATTRUU Index, US Govt Inflation-Linked Bonds represented by the BCIT1T Index, US Corporate Bonds represented by the LUACTRUU Index, US Corporate High Yield Bonds represented by the LF98TRUU Index, 60/40 Portfolio represented by the SPX Index and LBUSTRUU Index. Preqin, as of Q3 2021, Private Equity represented by the Preqin Private Equity Quarterly Index, Venture Capital represented by the Preqin Venture Capital Quarterly Index, Real Estate represented by the Preqin Real Estate Quarterly Index, Infrastructure represented by the Preqin Infrastructure Quarterly Index, Private Debt represented by the Preqin Private Debt Quarterly Index, Natural Resources represented by the Preqin Natural Resources Quarterly Index. HFR, as of Q3 2021, Hedge Funds represented by the HFRI Fund Weighted Composite Index.
This expanded opportunity set has also historically proven to provide access to a more efficient return and a greater return per unit of risk as measured by Sharpe ratios over 1.0. This feature of alternatives may allow for a more balanced risk budgeting process, since investors may accommodate an appropriate level of risk while seeking to maximize potential expected return - selecting those asset classes with the highest Sharpe ratios while being aware of the risk associated with each investment.
Finally, the correlations of alternative investments to stocks and bonds have historically been low-to-moderate over the ten-year horizon, despite a positive correlation. This may allow for a greater diversification benefit when these assets are added to a well-diversified portfolio.
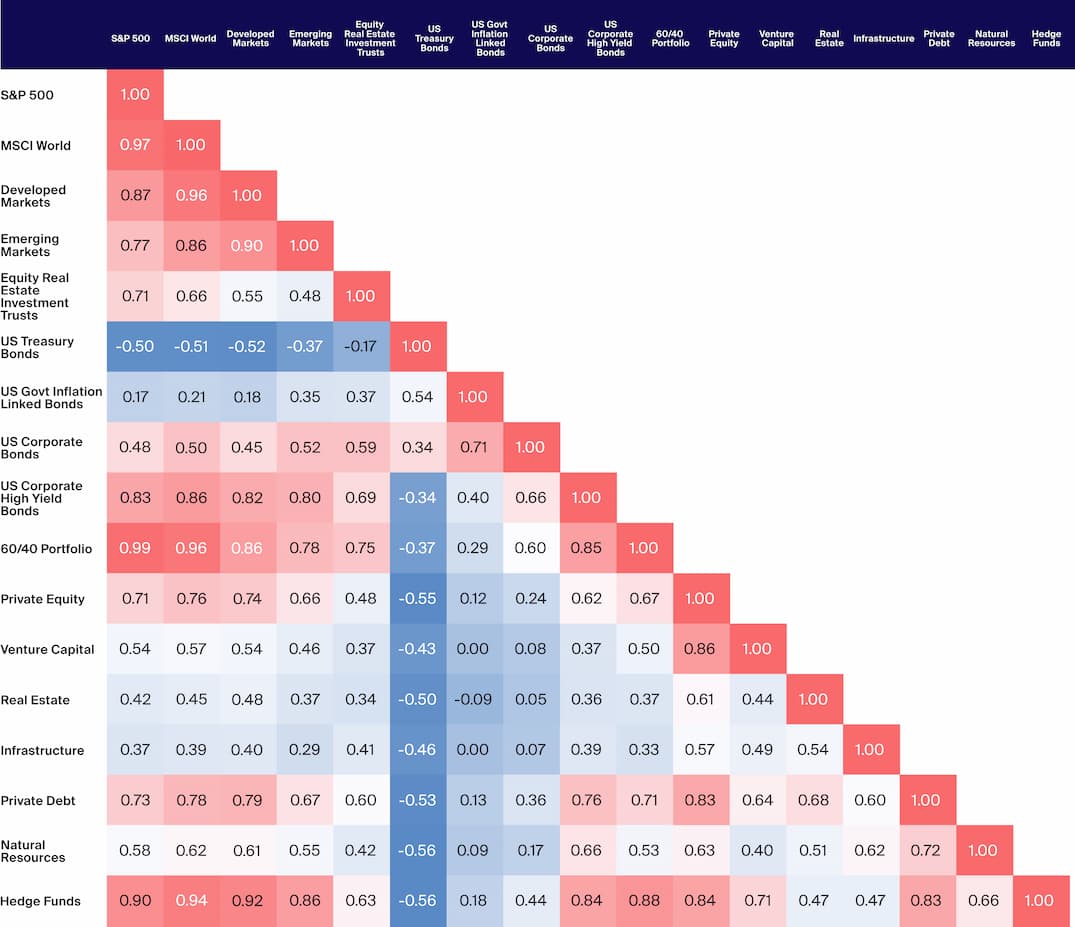
Source: Bloomberg, as of Q3 2021, S&P 500 represented by the SPX Index, MSCI World represented MXWO Index, Developed Markets represented by the MXEA Index, Emerging Markets represented by the MXEF Index, Equity Real Estate Investment Trusts represented by the FNER Index, US Treasury Bonds represented by the LUATTRUU Index, US Govt Inflation-Linked Bonds represented by the BCIT1T Index, US Corporate Bonds represented by the LUACTRUU Index, US Corporate High Yield Bonds represented by the LF98TRUU Index, 60/40 Portfolio represented by the SPX Index and LBUSTRUU Index. Preqin, as of Q3 2021, Private Equity represented by the Preqin Private Equity Quarterly Index, Venture Capital represented by the Preqin Venture Capital Quarterly Index, Real Estate represented by the Preqin Real Estate Quarterly Index, Infrastructure represented by the Preqin Infrastructure Quarterly Index, Private Debt represented by the Preqin Private Debt Quarterly Index, Natural Resources represented by the Preqin Natural Resources Quarterly Index, HFR, as of Q3 2021, Hedge Funds represented by the HFRI Fund Weighted Composite Index.
The correlations of alternative investments to stocks and bonds have historically been low-to-moderate over the ten-year horizon, despite a positive correlation. This may allow for a greater diversification benefit when these assets are added to a well-diversified portfolio.
Shifting Opportunity Can Require a Reset of Expectations
Inflection points in the markets and the economy, like the one we are currently experiencing now, generally offer investors the opportunity to reset their expectations to align with current and future opportunities. Often, investors think these situations are also opportunities to time their investments to the market, but it cannot be stressed enough that markets are typically very difficult to time. To illustrate this, we provide the table below, which shows the annual returns each year over the past 10 years, with each asset class’s return ranked from highest to lowest. It shows that no single asset class has led each period, highlighting the difficulty in selecting the best asset class or asset classes in each given year.

Source: Bloomberg, as of Q3 2021, S&P 500 represented by the SPX Index, MSCI World represented MXWO Index, Developed Markets represented by the MXEA Index, Emerging Markets represented by the MXEF Index, Equity Real Estate Investment Trusts represented by the FNER Index, US Treasury Bonds represented by the LUATTRUU Index, US Govt Inflation-Linked Bonds represented by the BCIT1T Index, US Corporate Bonds represented by the LUACTRUU Index, US Corporate High Yield Bonds represented by the LF98TRUU Index, 60/40 Portfolio represented by the SPX Index and LBUSTRUU Index, Preqin, as of Q3 2021, Private Equity represented by the Preqin Private Equity Quarterly Index, Venture Capital represented by the Preqin Venture Capital Quarterly Index, Real Estate represented by the Preqin Real Estate Quarterly Index, Infrastructure represented by the Preqin Infrastructure Quarterly Index, Private Debt represented by the Preqin Private Debt Quarterly Index, Natural Resources represented by the Preqin Natural Resources Quarterly Index, HFR, as of Q3 2021, Hedge Funds represented by the HFRI Fund Weighted Composite Index.
The table below shows the annual returns each year over the past 10 years, with each asset class’s return ranked from highest to lowest. It shows that no single asset class has led each period, highlighting the difficulty in selecting the best asset class or asset classes in each given year.
Alternatives investments as we have seen have the potential to provide higher risk/reward and diversification in a portfolio. The higher returns often attributed to alternative investments are met with risks and can result in some characteristics that differ from traditional investments. Alternatives are often associated with longer-term investments for their value-creation strategies to play out, sometimes requiring a multi-year investment horizon. Alternatives are also generally private investments and are subject to limited regulations compared with public investments. This contrasts notably with traditional assets like stocks and bonds, which can be traded directly on exchanges or owned in funds, such as mutual funds and exchange-traded funds (ETFs), both of which are relatively liquid, transparent and regulated. Alternative investments are generally less liquid than traditional asset classes because the funds and many of the underlying assets are not publicly traded and may lack a secondary market. The higher level of risk associated with many alternative investments has often restricted ownership to institutional investors or those deemed capable of understanding the investments and their associated risks. Similarly, minimum investments are typically set higher, although this is beginning to change with some innovative product development.
We would argue that there is more often an opportunity to update and reassess, not only the tactical asset allocation, but their overall strategic asset allocation. Given the expanded opportunity set that an advisor can access by adding alternatives to their portfolio, even in comparison to a future that may look very different from the past, there remain abundant investment opportunities in the (alternative) universe.


